Nextracker Inc Stock Fair Value – NEXTRACKER INC Reports Q1 FY2024 Earnings with 18.9% Revenue Increase, 15.3% Net Income Decrease
August 12, 2023

☀️Earnings Overview
NEXTRACKER INC ($NASDAQ:NXT) reported total revenue of USD 479.5 million for its first quarter of FY2024, on June 30 2023 — an 18.9% increase compared to the same period in the previous year. However, net income decreased 15.3%, year over year, to USD 20.4 million.
Analysis – Nextracker Inc Stock Fair Value
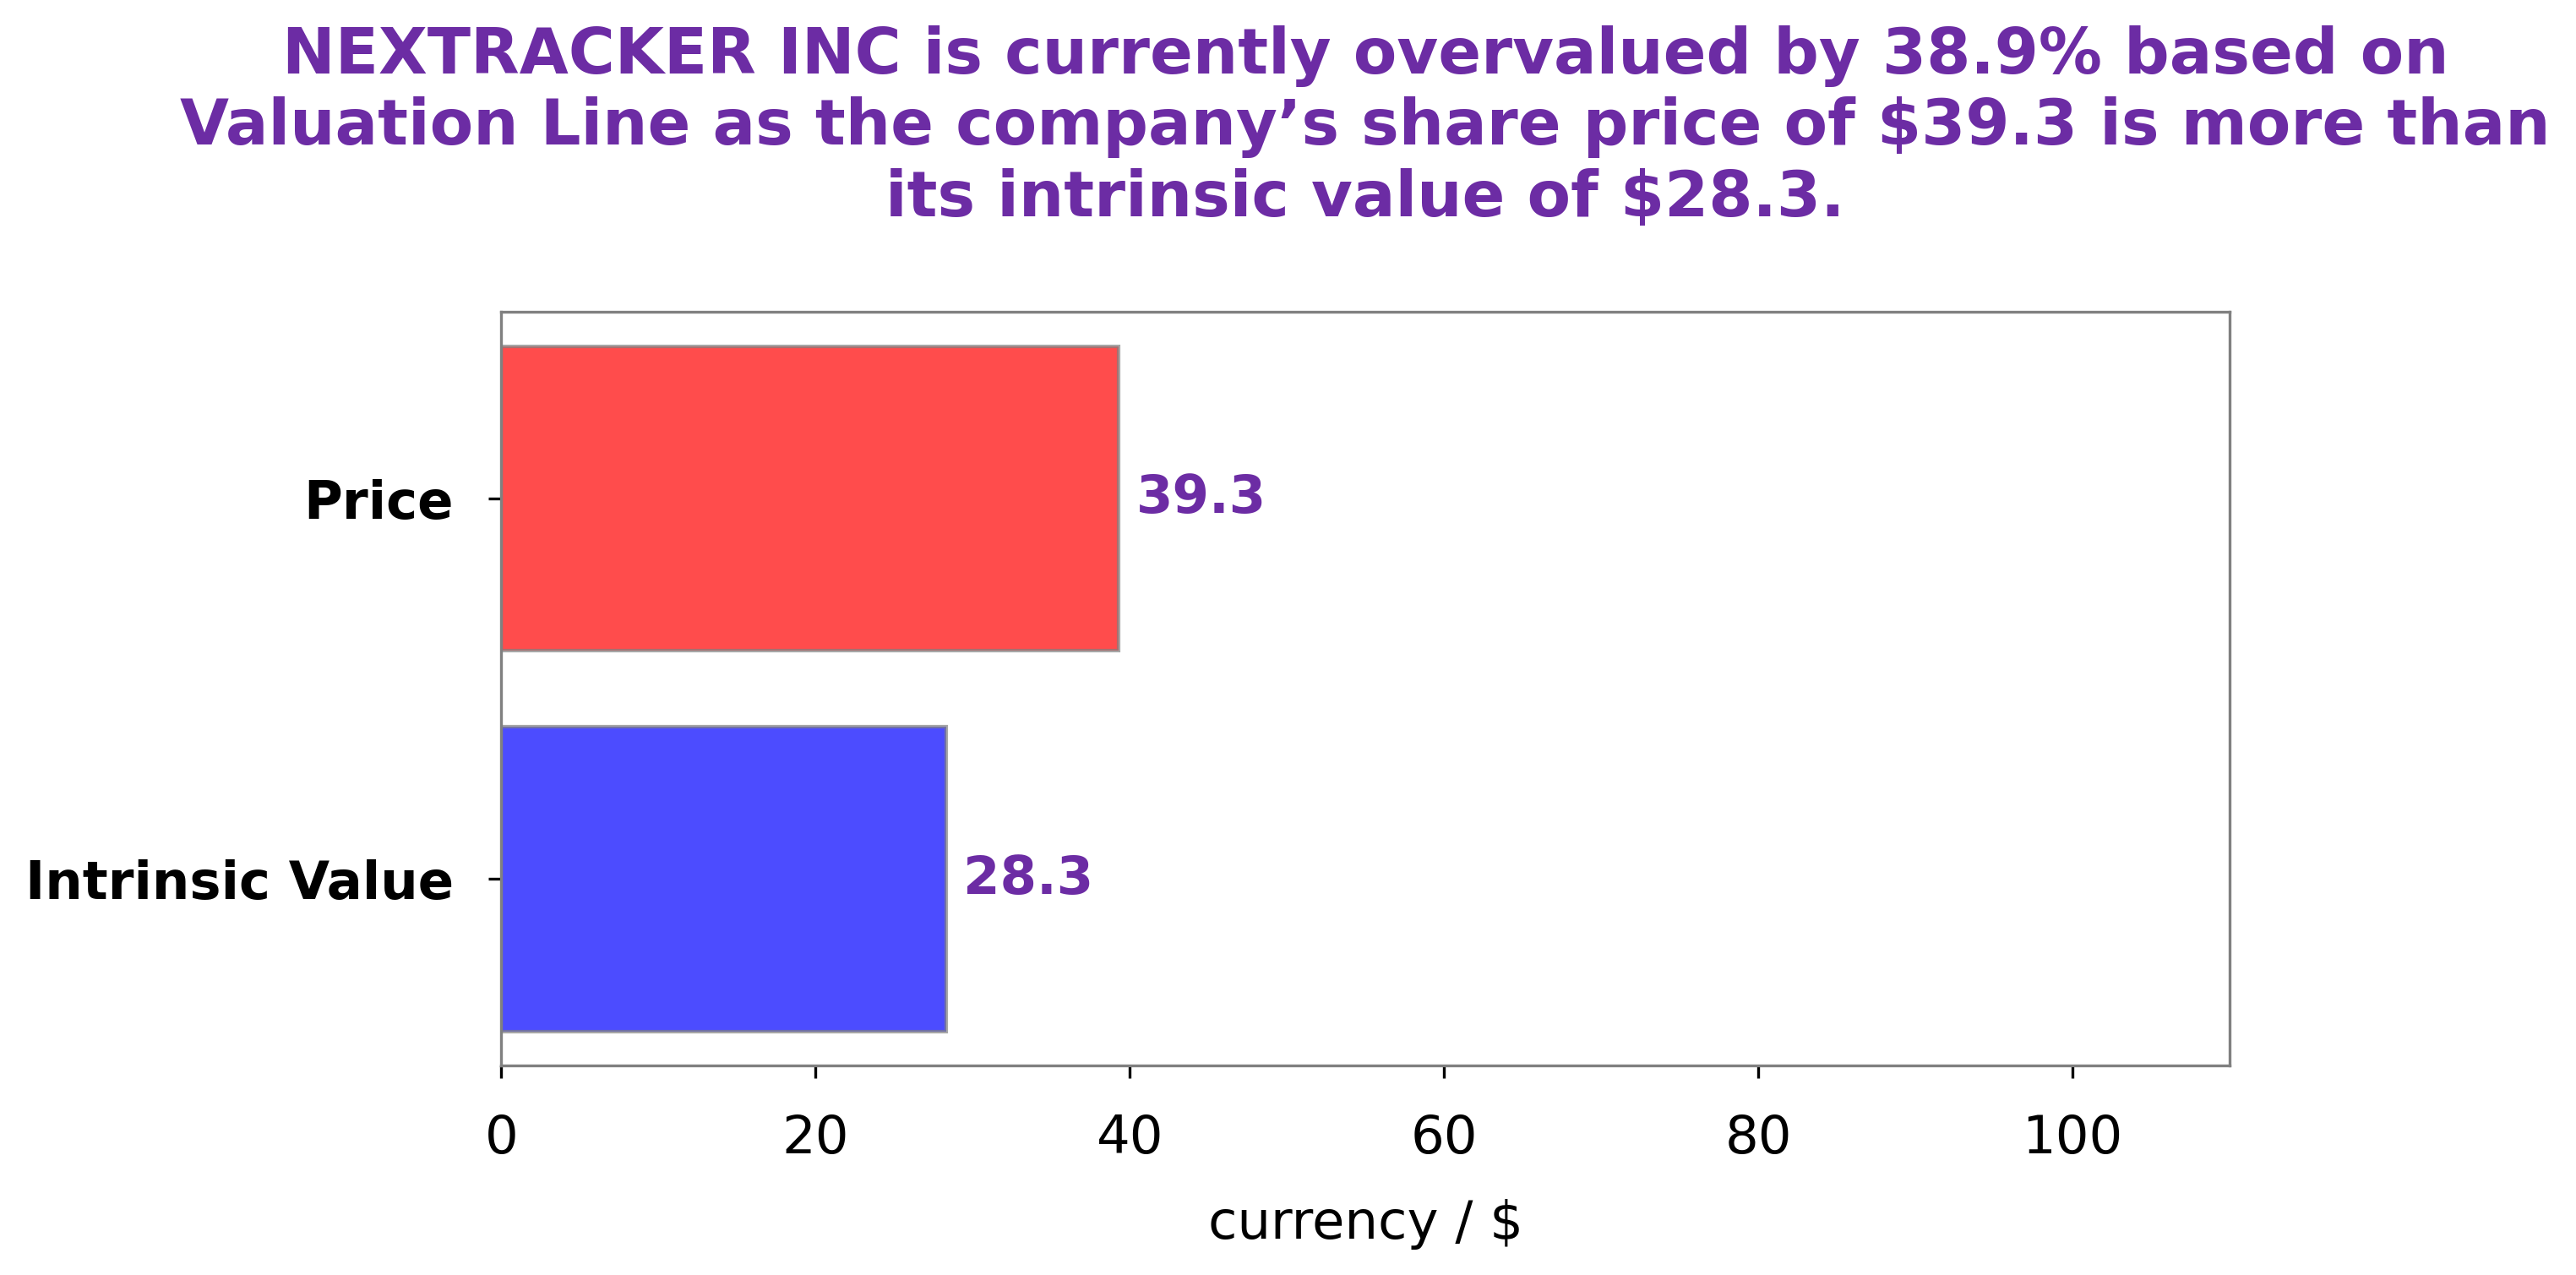
GoodWhale has completed an analysis of NEXTRACKER INC‘s fundamentals and found that the intrinsic value of the company’s share is currently around $28.3. This value was determined using GoodWhale’s proprietary Valuation Line. Despite this relatively low intrinsic value, NEXTRACKER INC stock is currently being traded at $39.3, a 38.7% premium over the underlying value of the stock. This makes NEXTRACKER INC stock currently overvalued according to our analysis. More…
About the Company
Income Snapshot
Below shows the total revenue, net income and net margin for Nextracker Inc. More…
| Total Revenues | Net Income | Net Margin |
| 1.98k | 141.76 | 5.9% |
Cash Flow Snapshot
Below shows the cash from operations, investing and financing for Nextracker Inc. More…
| Operations | Investing | Financing |
| 330.64 | -3.43 | -3.26 |
Balance Sheet Snapshot
Below shows the total assets, liabilities and book value per share for Nextracker Inc. More…
| Total Assets | Total Liabilities | Book Value Per Share |
| 1.66k | 1.1k | -54.08 |
Key Ratios Snapshot
Some of the financial key ratios for Nextracker Inc are shown below. More…
| 3Y Rev Growth | 3Y Operating Profit Growth | Operating Margin |
| 17.5% | 4.2% | 10.7% |
| FCF Margin | ROE | ROA |
| 16.5% | -4.1% | 8.0% |
Peers
The development of solar technology has seen an increase in competition between the leading solar companies, including NEXTracker Inc, Three Sixty Solar Ltd, Surana Solar Ltd, and Canadian Solar Inc. These companies are continuously pushing each other to develop innovative solutions to promote renewable energy, ultimately leading to higher quality products at more cost effective prices for customers.
– Three Sixty Solar Ltd ($BER:AJ6)
Three Sixty Solar Ltd is a renewable energy company that develops solar power solutions for residential, commercial, and industrial applications. The company has a market cap of 17.3M as of 2023, indicating strong financial stability and market confidence. Its Return on Equity (ROE) of -40.54% suggests that the company is under-performing in terms of profitability, and may be in need of an improved strategy to increase its financial returns. Despite this, Three Sixty Solar Ltd has a strong market cap and remains a viable business with potential for growth.
– Surana Solar Ltd ($BSE:533298)
Surana Solar Ltd is an India-based energy company that specializes in solar power generation and distribution. The company is a leader in India’s renewable energy sector, with a market cap of 1.02 billion as of 2023. This indicates the company’s strong financial performance and investor confidence in its future prospects. The company’s Return on Equity (ROE) of 3.59% is also a sign of its financial stability. Surana Solar is well positioned to continue to grow and make significant contributions to India’s renewable energy industry in the foreseeable future.
– Canadian Solar Inc ($NASDAQ:CSIQ)
Canadian Solar Inc is a leading global provider of solar energy solutions. Founded in 2001, the company designs, manufactures, and sells solar modules and other products, as well as provides solar system services. As of 2023, Canadian Solar Inc had a market cap of 2.36B, representing a significant increase from their market cap of 1.77B in 2021. The company also boasted a strong Return on Equity (ROE) of 14.45%, indicating that the company is efficiently using its resources to generate profits for shareholders.
Summary
Investors should be encouraged by NEXTRACKER INC‘s first quarter FY2024 earnings report, as total revenue rose 18.9% from the prior year and exceeded expectations. Net income showed a 15.3% decrease from the prior year, however this was due to higher expenses related to increased investments in research and development. Overall, the performance of the company still indicates long-term growth potential that investors should be confident about in the future.
Related Posts


Recent Posts


