MLCO Intrinsic Value Calculator – MELCO RESORTS & ENTERTAINMENT Reports Third Quarter Financial Results for FY2023
December 5, 2023

☀️Earnings Overview
MELCO RESORTS & ENTERTAINMENT ($NASDAQ:MLCO) reported their financials for Q3 of FY2023 (July 1 – September 30 2023), which resulted in total revenue of USD 1017.2 million, a massive increase from Q3 of FY2022 when it was 241.8 million. Net income for the quarter was USD -16.3 million, much better than the -243.8 million posted in the corresponding quarter of the previous year.
Share Price
On Wednesday, MELCO RESORTS & ENTERTAINMENT reported their financial results for the third quarter of the fiscal year 2023. The shares opened at $7.8 and closed at $7.9, up 4.2% from their previous closing price of $7.5. The increase in revenue was mainly attributed to strong performance in Macau, Singapore and the Philippines, as well as increased gaming revenue in the US and international markets. This reflects the confidence that the company has in their future prospects and ability to deliver strong financial results for investors. Live Quote…
About the Company
Income Snapshot
Below shows the total revenue, net income and net margin for MLCO. More…
| Total Revenues | Net Income | Net Margin |
| 3.02k | -372.97 | -12.3% |
Cash Flow Snapshot
Below shows the cash from operations, investing and financing for MLCO. More…
| Operations | Investing | Financing |
| -619.43 | -806.11 | 1.78k |
Balance Sheet Snapshot
Below shows the total assets, liabilities and book value per share for MLCO. More…
| Total Assets | Total Liabilities | Book Value Per Share |
| 8.71k | 9.37k | -2.57 |
Key Ratios Snapshot
Some of the financial key ratios for MLCO are shown below. More…
| 3Y Rev Growth | 3Y Operating Profit Growth | Operating Margin |
| 4.4% | 27.2% | -0.5% |
| FCF Margin | ROE | ROA |
| -41.1% | 0.8% | -0.1% |
Analysis – MLCO Intrinsic Value Calculator
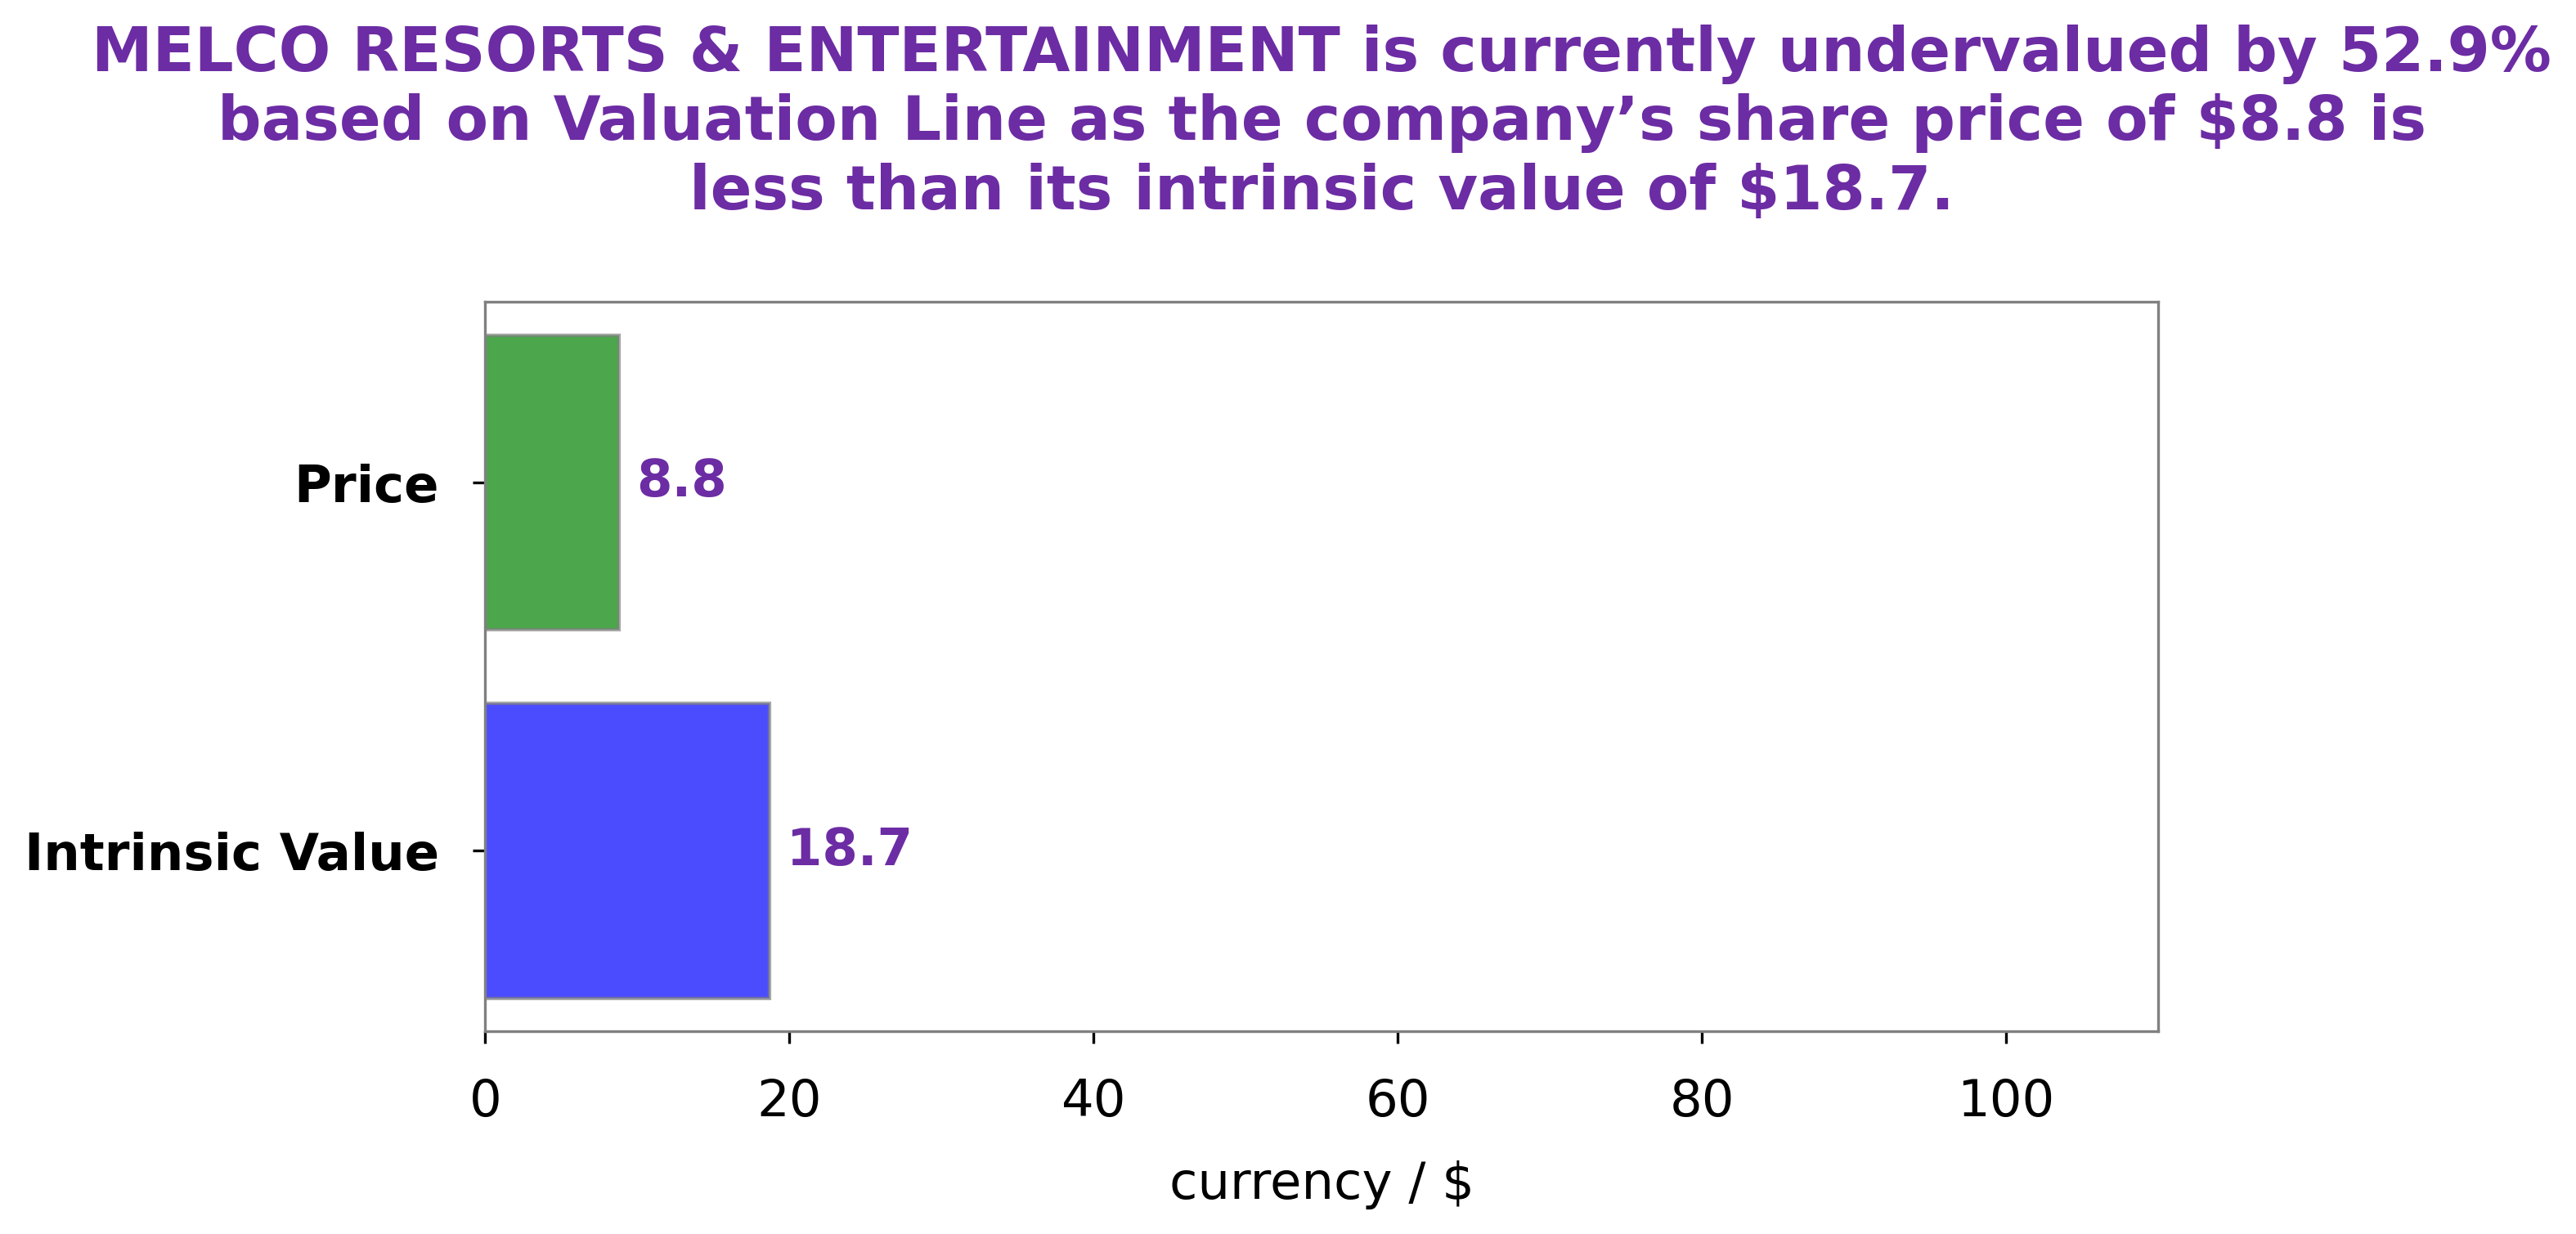
At GoodWhale, we analyze MELCO RESORTS & ENTERTAINMENT’s financials to give our customers the most accurate and comprehensive insights. By using our proprietary Valuation Line, we found that the intrinsic value of MELCO RESORTS & ENTERTAINMENT’s share is around $19.6. This means that the stock is currently undervalued by 59.8%, as it is trading at just $7.9. This presents a great opportunity for investors to get into MELCO RESORTS & ENTERTAINMENT at a bargain price. More…
Peers
Each of these companies has its own unique strengths and strategies to stay ahead of the game, creating a dynamic and intense competition between them.
– Las Vegas Sands Corp ($NYSE:LVS)
Las Vegas Sands Corp is an American casino and resort company based in the US state of Nevada. It is the parent company of the Venetian Casino Resort and the Sands Expo and Convention Center, among other properties. The company has a market cap of 36.73B as of 2022, which is a reflection of its market presence and business performance. Additionally, its Return on Equity (ROE) stands at -11.56%, indicating that it is not performing well in terms of generating shareholder value. Las Vegas Sands Corp is a leader in the gaming and hospitality industry, and it continues to be a major player in Las Vegas, Macau, and other international markets.
– Wynn Resorts Ltd ($NASDAQ:WYNN)
Wynn Resorts Ltd is a global hospitality and entertainment company, operating integrated resorts in Las Vegas, Macau, and other parts of the world. As of 2022, the company has a market capitalization of 9.34 billion dollars and a return on equity of 27.93%. This suggests that the company is performing relatively well and is able to generate a healthy return on the capital it has invested. The company has positioned itself as an international leader in the hospitality and entertainment industry, with a focus on providing high-quality experiences for its guests. The strong financial performance of the company indicates that its strategies are working and that it is well-positioned for future growth.
– MGM Resorts International ($NYSE:MGM)
MGM Resorts International is a leading global hospitality and entertainment company, based in Las Vegas, Nevada. The company operates a portfolio of destination resort brands including Bellagio, MGM Grand, Mandalay Bay, The Mirage, Park MGM, and New York-New York. With a market cap of 12.88 billion USD as of 2022, the company’s stock has been performing well in the market with a Return on Equity (ROE) of 20.62%. This indicates a strong financial performance and suggests that the company is utilizing its equity to generate profits and add value to its shareholders.
Summary
Additionally, the company saw a substantial improvement in net income, from -243.8 million in Q3 of FY2022 to -16.3 million in Q3 of FY2023. Following these positive results, the stock price rose accordingly. Investors may be encouraged by these figures, suggesting that the company is on the upswing and may have good prospects for future success.


