MAGIC SOFTWARE ENTERPRISES Reports Impressive Q1 Earnings for FY2023
May 27, 2023

Earnings Overview
On May 18th, 2023, MAGIC SOFTWARE ENTERPRISES ($NASDAQ:MGIC) announced its financial results for the first quarter of FY2023 (ending March 31st, 2023). Total revenue rose 2.7% on a year-over-year basis to reach USD 142.4 million, while net income increased 5.1% to USD 10.1 million.
Price History
On Thursday, MAGIC SOFTWARE ENTERPRISES reported a successful first quarter of the fiscal year ending 2023. Shares opened at $14.4 and closed at the same price, a 1.3% increase from the prior closing price of 14.2. MAGIC SOFTWARE ENTERPRISES was one of the most successful stocks of the day, with investors eager to get a piece of the action. The impressive Q1 earnings for MAGIC SOFTWARE ENTERPRISES is a testament to the company’s strong management and commitment to providing innovative solutions to their clients. This has been a result of their focus on improving customer experience and offering high-quality products and services. The impressive Q1 earnings have been a result of their strategy to expand into new markets and improve their customer experience even further.
The company has seen great success in offering tailored solutions to its customers, allowing them to get the most out of their investments. The company has also been investing heavily in research and development to stay ahead of the competition and remain at the top of their industry. MAGIC SOFTWARE ENTERPRISES has proven itself to be a leader in the industry with their impressive Q1 earnings. The confidence investors have in the company is evident in their stock price, which continues to rise steadily despite the ever-changing markets. The future looks bright for MAGIC SOFTWARE ENTERPRISES, and investors are sure to benefit from their continued success. Live Quote…
About the Company
Income Snapshot
Below shows the total revenue, net income and net margin for MGIC. More…
| Total Revenues | Net Income | Net Margin |
| 570.53 | 40.86 | 7.0% |
Cash Flow Snapshot
Below shows the cash from operations, investing and financing for MGIC. More…
| Operations | Investing | Financing |
| 62.6 | -36.26 | -25.06 |
Balance Sheet Snapshot
Below shows the total assets, liabilities and book value per share for MGIC. More…
| Total Assets | Total Liabilities | Book Value Per Share |
| 521.04 | 251.97 | 5.2 |
Key Ratios Snapshot
Some of the financial key ratios for MGIC are shown below. More…
| 3Y Rev Growth | 3Y Operating Profit Growth | Operating Margin |
| 18.9% | 20.9% | 10.9% |
| FCF Margin | ROE | ROA |
| 9.7% | 15.0% | 7.5% |
Analysis
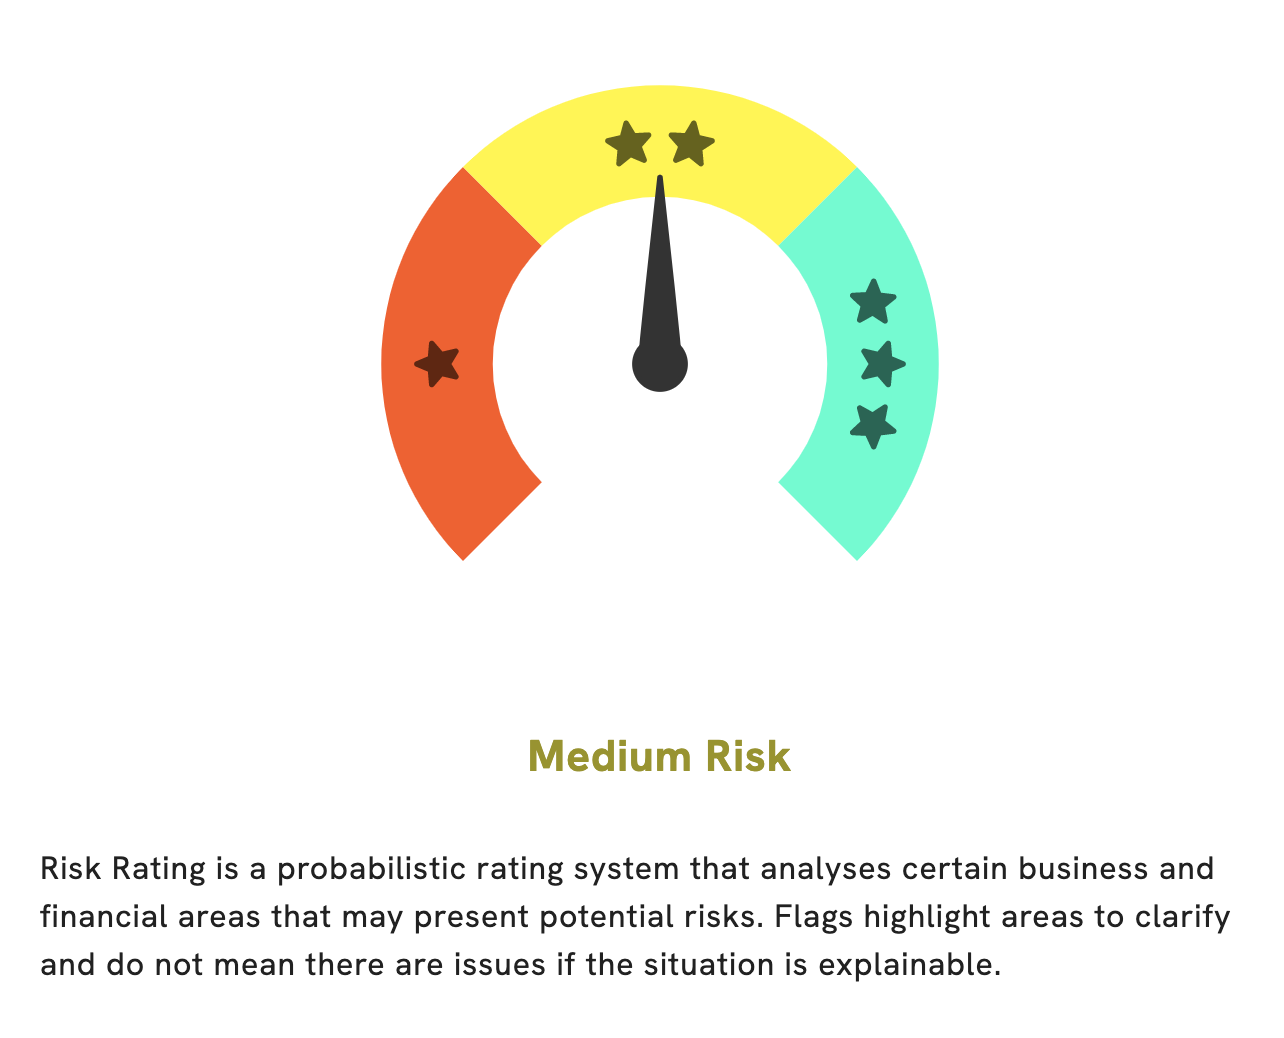
At GoodWhale, we believe it’s important to be informed about the financials of your investment targets. That’s why we provide a comprehensive analysis of MAGIC SOFTWARE ENTERPRISES’s financials. After examining their financials, we conclude that this company is a medium risk investment in terms of both financial and business aspects. We have detected two risk warnings in MAGIC SOFTWARE ENTERPRISES’s income sheet and balance sheet. These warnings provide you with an early indication of any possible risk factors that could affect your investments. To see further details on these risk warnings, make sure to register on goodwhale.com. More…
Peers
All four companies strive to stay ahead of the curve by developing innovative software solutions and providing ever-improving customer service. The competition between these leading software companies is fierce and is sure to bring about exciting new developments in the industry.
– Claranova SA ($BER:BV51)
Claranova SA is a French software company that offers digital solutions for professionals and other users. The company specializes in helping users create content for digital media, the development of connected objects and devices, and the secure distribution of digital applications. Its market capitalization of 79.92M as of 2023 reflects its strong financial performance, as evidenced by its Return on Equity of 9.21%. This return on equity signifies that Claranova SA is making effective use of its retained earnings and is achieving a satisfactory return on its shareholder’s capital. This company is well-positioned to continue to grow and develop its products, services, and customer base.
– Infotel SA ($LTS:0OQQ)
Infotel SA is a French telecommunications company that is specialized in developing telecommunications solutions and services for businesses. With a market cap of 385.75M Euros as of 2023, the company has been able to demonstrate a sound financial performance. This has been largely due to their impressive return on equity (ROE) of 15.87%. This suggests that the company has been able to efficiently reinvest its earnings to generate higher returns, making it an attractive investment opportunity.
– Tranway Technologies Ltd ($BSE:542923)
Tranway Technologies Ltd is a technology company specializing in the development of software solutions and services for businesses. As of 2023, the company has a market capitalization of 100.69M and a Return on Equity of 2.81%. The market cap of a company is the total value of its outstanding shares, and it is an indicator of the size and strength of the firm. The ROE, on the other hand, is a measure of how effectively management is utilizing the company’s equity to generate profits, and Tranway Technologies Ltd’s ROE of 2.81% indicates that it is efficiently generating returns for its owners.
Summary
MAGIC SOFTWARE ENTERPRISES reported strong financial results for FY2023 Q1, with total revenue of USD 142.4 million and net income of USD 10.1 million, representing year-over-year increases of 2.7% and 5.1%, respectively. Investors analyzing these numbers may be encouraged by the growth in both revenues and profits, as well as the company’s ability to stay profitable in a challenging business environment. The company’s healthy balance sheet and outlook for further growth make it an attractive option for investors looking for a steady, long-term investment.
Related Posts


Recent Posts


