Lee Enterprises Reports Q4 FY2023 Earnings with 15.3% Decrease in Revenue
December 15, 2023

🌥️Earnings Overview
On December 7, 2023, LEE ENTERPRISES ($NASDAQ:LEE) reported their FY2023 Q4 earnings results, displaying a total revenue of USD 164.0 million, a decrease of 15.3% from the same period in the previous year. Net income for the quarter was USD -2.0 million, representing a reduction from the -6.3 million reported in the prior year.
Analysis
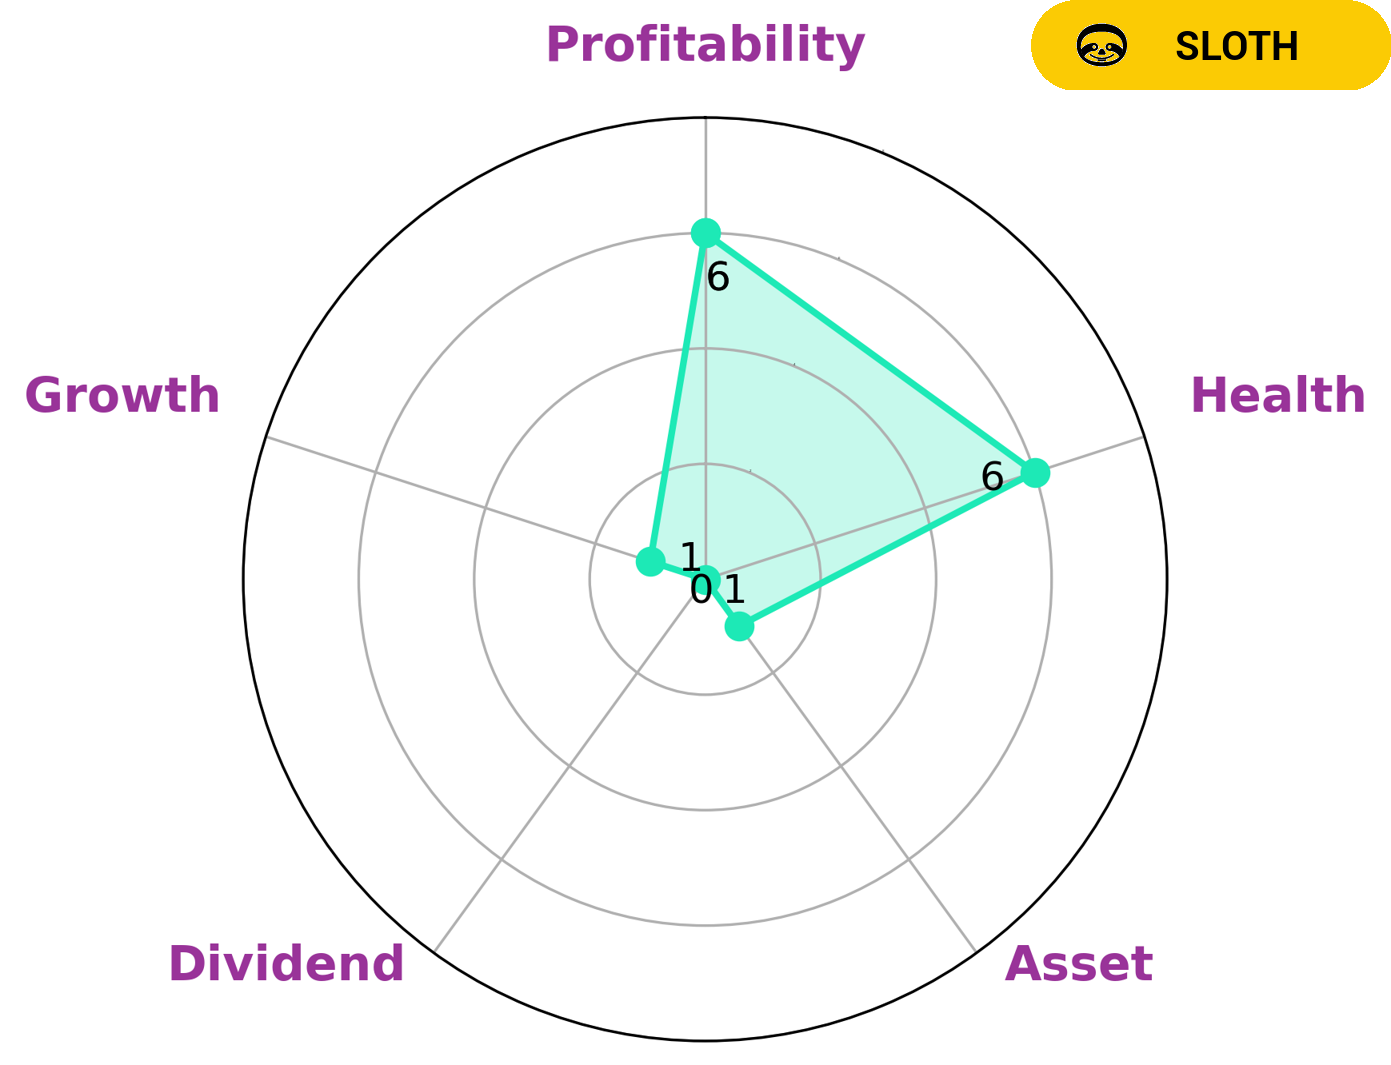
GoodWhale has provided an analysis of the fundamentals of LEE ENTERPRISES. According to Star Chart, LEE ENTERPRISES is strong in financial strength, medium in profitability, and weak in asset, dividend, and growth. The company has been classified as a ‘sloth’, a company whose revenue and earnings growth has been slower than the overall economy. Investors that may be interested in such a company could include value investors who are looking for companies that are undervalued and trading at a discount to their intrinsic value, income investors who are looking for steady dividends, and patient investors who are willing to wait for any potential long-term rewards. Despite its weaknesses, LEE ENTERPRISES has an intermediate health score of 6/10 with regard to its cashflows and debt. This indicates that the company might be able to pay off debt and fund future operations. As such, it could be a good option for investors looking for a stable and profitable investment. More…
About the Company
Income Snapshot
Below shows the total revenue, net income and net margin for Lee Enterprises. More…
| Total Revenues | Net Income | Net Margin |
| 691.14 | -5.27 | 1.1% |
Cash Flow Snapshot
Below shows the cash from operations, investing and financing for Lee Enterprises. More…
| Operations | Investing | Financing |
| 1.23 | 6.34 | -19.69 |
Balance Sheet Snapshot
Below shows the total assets, liabilities and book value per share for Lee Enterprises. More…
| Total Assets | Total Liabilities | Book Value Per Share |
| 722.82 | 708.23 | 2.01 |
Key Ratios Snapshot
Some of the financial key ratios for Lee Enterprises are shown below. More…
| 3Y Rev Growth | 3Y Operating Profit Growth | Operating Margin |
| 3.8% | -6.5% | 5.6% |
| FCF Margin | ROE | ROA |
| -0.6% | 196.6% | 3.3% |
Peers
Lee Enterprises Inc is an established leader in the media industry, competing against other companies such as AdTheorent Holding Co Inc, Propel Media Inc, and Meta Media Holdings Ltd. Despite the presence of these formidable rivals, Lee Enterprises Inc has been able to maintain its position as a major player in the market through strategic investments and operational excellence.
– AdTheorent Holding Co Inc ($NASDAQ:ADTH)
AdTheorent Holding Co Inc is a leading digital advertising company that specializes in providing innovative technology solutions and services to help brands create and deliver engaging and meaningful customer experiences. As of 2022, the company has a market capitalization of 134.7M and a Return on Equity of 18.12%. This indicates that the company is performing well and is able to generate an attractive return on its shareholders’ investments. AdTheorent Holding Co Inc’s strong financial performance and robust market cap are further testament to its position in the industry as a leader in the digital advertising space.
– Propel Media Inc ($OTCPK:PROM)
Propel Media Inc is a digital marketing company that specializes in performance-based advertising. The company has a market cap of 19.98M as of 2022, making it a relatively small company compared to its peers. Its Return on Equity (ROE) is -67.1%, indicating that the company has not been performing well financially. This could be due to poor management or a lack of investment in the company. In either case, Propel Media Inc needs to improve its performance if it wants to remain competitive in the industry.
– Meta Media Holdings Ltd ($SEHK:00072)
Meta Media Holdings Ltd is a leading provider of digital media solutions. The company specializes in the development of websites, mobile applications, and other digital media products for both enterprise and consumer markets. As of 2022, Meta Media Holdings Ltd has a market capitalization of 153.42M which indicates that the company is performing well in the market. Additionally, its Return on Equity (ROE) stands at 1.77%, indicating that the company’s investments are generating a good return on investment.
Summary
Lee Enterprises reported their Q4 earnings results for FY2023 on December 7, with total revenue of $164 million, a 15.3% drop from the previous year. Net income for the quarter was negative $2 million, compared to -$6.3 million the year before. The stock price reacted negatively to these news, suggesting investors are cautious about the company’s performance.
With the economic recovery still uncertain, it may be worth considering if Lee Enterprises is a good long-term investment. Investors should carefully evaluate Lee’s earnings report and consider future market conditions before making any decisions.
Related Posts


Recent Posts


