Kroger Stock Fair Value Calculation – KROGER Reports Third Quarter FY2024 Earnings Results on October 31, 2023
December 12, 2023

🌥️Earnings Overview
KROGER ($NYSE:KR) reported total revenue of USD 33957.0 million for the third quarter of FY2024, which ended on November 30 2023 – a decrease of 0.7% compared to the same period in the previous year. However, net income for the quarter rose 62.3% to USD 646.0 million from the same period in the prior year.
Market Price
On Thursday, October 31, 2023, KROGER reported its third quarter Fiscal Year 2024 earnings results. The stock opened at $43.6 and closed at $44.3, up by 1.4% from the previous day’s closing price of $43.6 and showing a positive outlook for the company. This quarterly report was the first since the company announced its strategic partnership with Ocado Group PLC in July. The partnership will allow KROGER to leverage its strengths in the digital grocery space and expand its customer base.
The company is also investing heavily in store upgrades and technology solutions such as “scan and go” self-checkout technology to improve customer experience. KROGER’s strong third quarter performance had a positive impact on its share price and the company’s outlook for the future. Investors are encouraged by the company’s investments in store upgrades and technology solutions as well as its strategic partnership with Ocado Group PLC, which has the potential to give it a competitive edge in the digital grocery space. Live Quote…
About the Company
Income Snapshot
Below shows the total revenue, net income and net margin for Kroger. More…
| Total Revenues | Net Income | Net Margin |
| 147.8k | 1.88k | 1.2% |
Cash Flow Snapshot
Below shows the cash from operations, investing and financing for Kroger. More…
| Operations | Investing | Financing |
| 6.03k | -3.57k | -1.65k |
Balance Sheet Snapshot
Below shows the total assets, liabilities and book value per share for Kroger. More…
| Total Assets | Total Liabilities | Book Value Per Share |
| 51.02k | 39.83k | 14.77 |
Key Ratios Snapshot
Some of the financial key ratios for Kroger are shown below. More…
| 3Y Rev Growth | 3Y Operating Profit Growth | Operating Margin |
| 4.2% | -7.7% | 2.0% |
| FCF Margin | ROE | ROA |
| 1.6% | 17.5% | 3.6% |
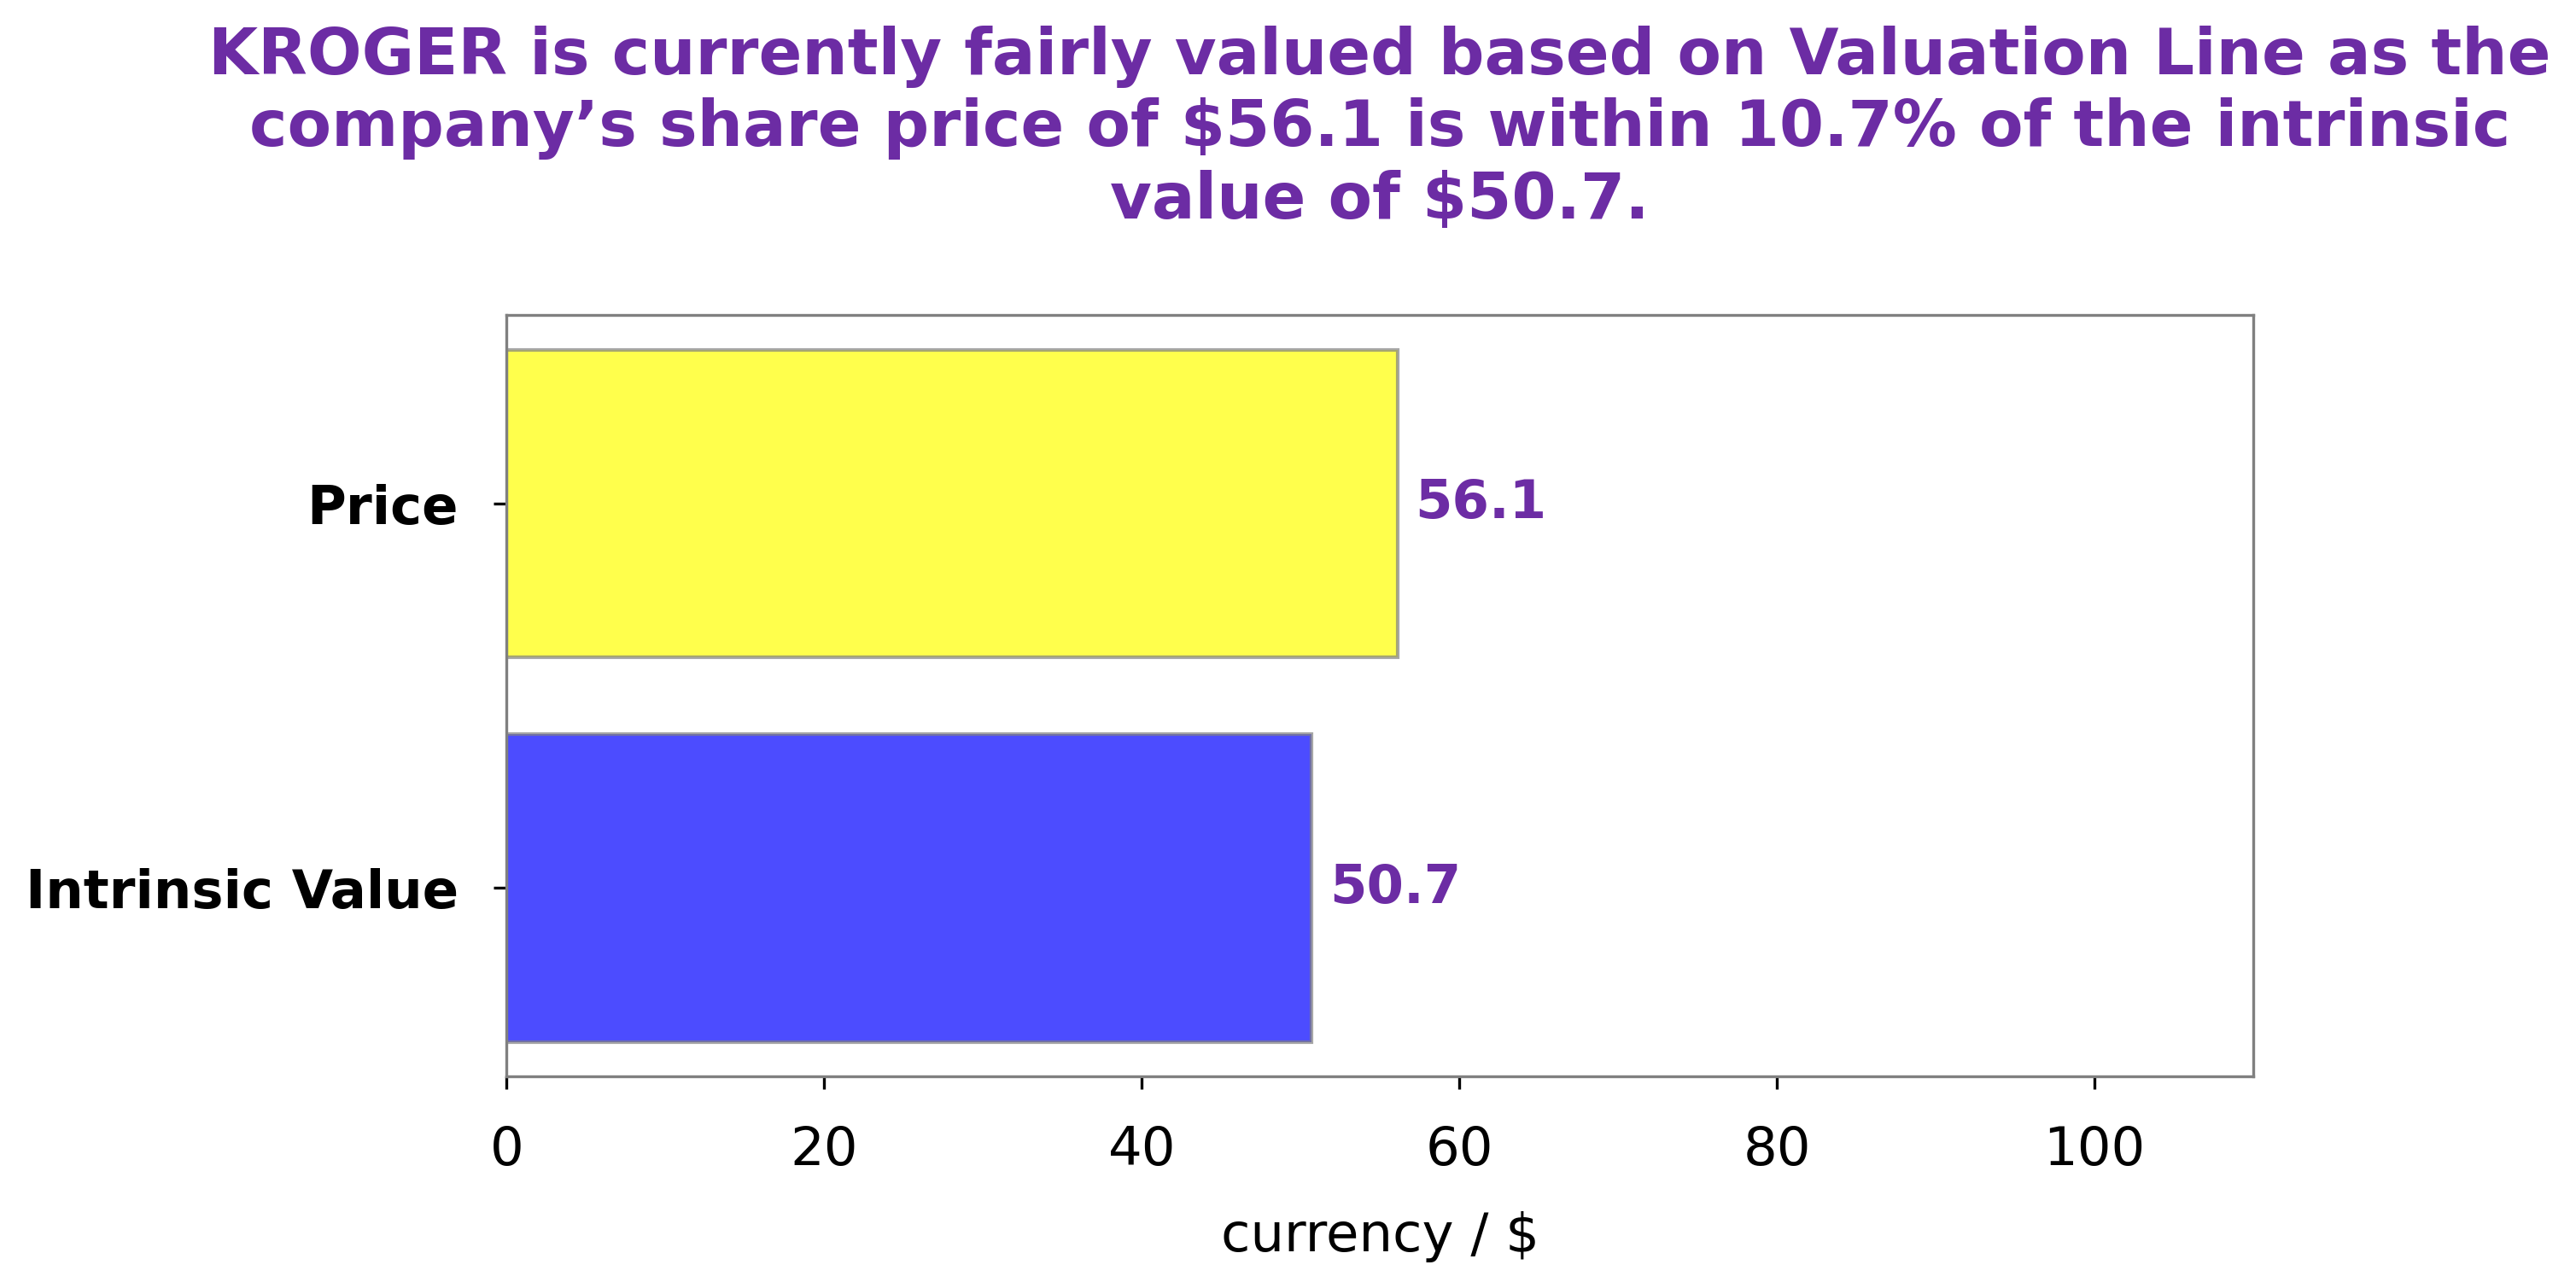
Analysis – Kroger Stock Fair Value Calculation
At GoodWhale, we conducted an analysis of KROGER‘s wellbeing. Our proprietary Valuation Line was used to calculate the fair value of KROGER shares, and it showed that the stock should be traded at $48.4. Right now, KROGER stock is being traded at $44.3, undervaluing the stock by 8.5%. This provides investors with a great opportunity to buy KROGER shares at a fair price. More…
Peers
The Kroger Co is the largest supermarket chain in the United States. It operates 2,800 supermarkets and multi-department stores in 35 states and the District of Columbia under two dozen local banner names including Kroger, City Market, Dillons, Food 4 Less, Fred Meyer, Harris Teeter, Jay C, King Soopers, QFC, Ralphs and Smith’s. Albertsons Companies Inc is the 2nd largest supermarket chain in the United States with 2,200 stores across 34 states and the District of Columbia. Sprouts Farmers Market Inc is the 3rd largest U.S. supermarket chain with 340 stores across 22 states. Grocery Outlet Holding Corp is the 4th largest U.S. supermarket chain with nearly 300 stores across 23 states.
– Albertsons Companies Inc ($NYSE:ACI)
Albertsons Companies Inc is a grocery store chain in the United States. It is the second-largest grocery store chain in the country after Walmart. The company has a market cap of 14.26B as of 2022 and a Return on Equity of 45.75%. Albertsons was founded in 1939 in Boise, Idaho. The company operates stores under the Albertsons, Safeway, Vons, Pavilions, Randalls, Tom Thumb, and Carrs banners. The company also has a pharmacy chain, under the Albertsons Pharmacy banner.
– Sprouts Farmers Market Inc ($NASDAQ:SFM)
Sprouts Farmers Market Inc is a grocery store chain based in the United States. The company offers a variety of fresh and organic produce, meats, and other groceries. As of 2022, Sprouts Farmers Market Inc has a market cap of 3B and a Return on Equity of 21.14%. The company has been growing steadily in recent years, and its strong financial performance is expected to continue in the future.
– Grocery Outlet Holding Corp ($NASDAQ:GO)
Grocery Outlet Holding Corp is a publicly traded company that owns and operates a chain of discount grocery stores. The company was founded in 1946 and is headquartered in Emeryville, California. As of 2022, the company had a market cap of 3.22 billion and a return on equity of 6.43%. The company’s stores offer a wide variety of food and household products at discount prices.
Summary
KROGER reported their third quarter results for FY2024, showing total revenue in the amount of USD 33957.0 million, which was a slight decrease of 0.7% year-over-year. Net income, however, increased by 62.3% to USD 646.0 million. This suggests that although the company may have experienced some weakness in terms of top line growth, they have managed to cut costs and boost their profitability. Investors may wish to take this into consideration when evaluating KROGER’s performance and potential investment opportunities.


