Kraft Heinz Intrinsic Stock Value – KRAFT HEINZ Reports Earnings Results for FY2023 Q2 on August 2, 2023
August 8, 2023

🌥️Earnings Overview
KRAFT HEINZ ($NASDAQ:KHC) reported their financial earnings for the second quarter of FY2023, ending June 30th, 2023, on August 2nd, 2023. Total revenue for the quarter was USD 6721.0 million, a 2.5% increase compared to the same period last year. Net income for the quarter was USD 1000.0 million, compared to USD 265.0 million a year ago.
Market Price
On Wednesday, August 2, 2023, KRAFT HEINZ announced its financial results for the second quarter of fiscal year 2023. Shares of KRAFT HEINZ opened at $35.6, and closed at $36.3, a 1.2% increase from the prior closing price of $35.9. This was a noteworthy result considering the ongoing pandemic and its effect on the global economy. KRAFT HEINZ reported lower revenue for the quarter due to reduced demand for certain products due to the pandemic.
However, the company managed to reduce cost of goods sold and other expenses, leading to higher profitability and an improved bottom line. Furthermore, the company also reported a one-time gain due to the sale of some of its assets which added to the profit. KRAFT HEINZ strengthened its balance sheet by reducing its total debt and increasing cash reserves. This move improved the company’s financial flexibility and enabled it to take advantage of future opportunities. Overall, KRAFT HEINZ reported a strong second quarter and gave investors confidence in its long-term prospects despite the challenges posed by the pandemic. The company is optimistic for the year ahead and is focused on executing its strategy to drive growth and profitability in the coming quarters. Live Quote…
About the Company
Income Snapshot
Below shows the total revenue, net income and net margin for Kraft Heinz. More…
| Total Revenues | Net Income | Net Margin |
| 27.1k | 3.16k | 12.6% |
Cash Flow Snapshot
Below shows the cash from operations, investing and financing for Kraft Heinz. More…
| Operations | Investing | Financing |
| 3.27k | -645 | -3.18k |
Balance Sheet Snapshot
Below shows the total assets, liabilities and book value per share for Kraft Heinz. More…
| Total Assets | Total Liabilities | Book Value Per Share |
| 90.96k | 40.94k | 40.56 |
Key Ratios Snapshot
Some of the financial key ratios for Kraft Heinz are shown below. More…
| 3Y Rev Growth | 3Y Operating Profit Growth | Operating Margin |
| 2.2% | -0.0% | 17.4% |
| FCF Margin | ROE | ROA |
| 8.4% | 6.0% | 3.2% |
Analysis – Kraft Heinz Intrinsic Stock Value
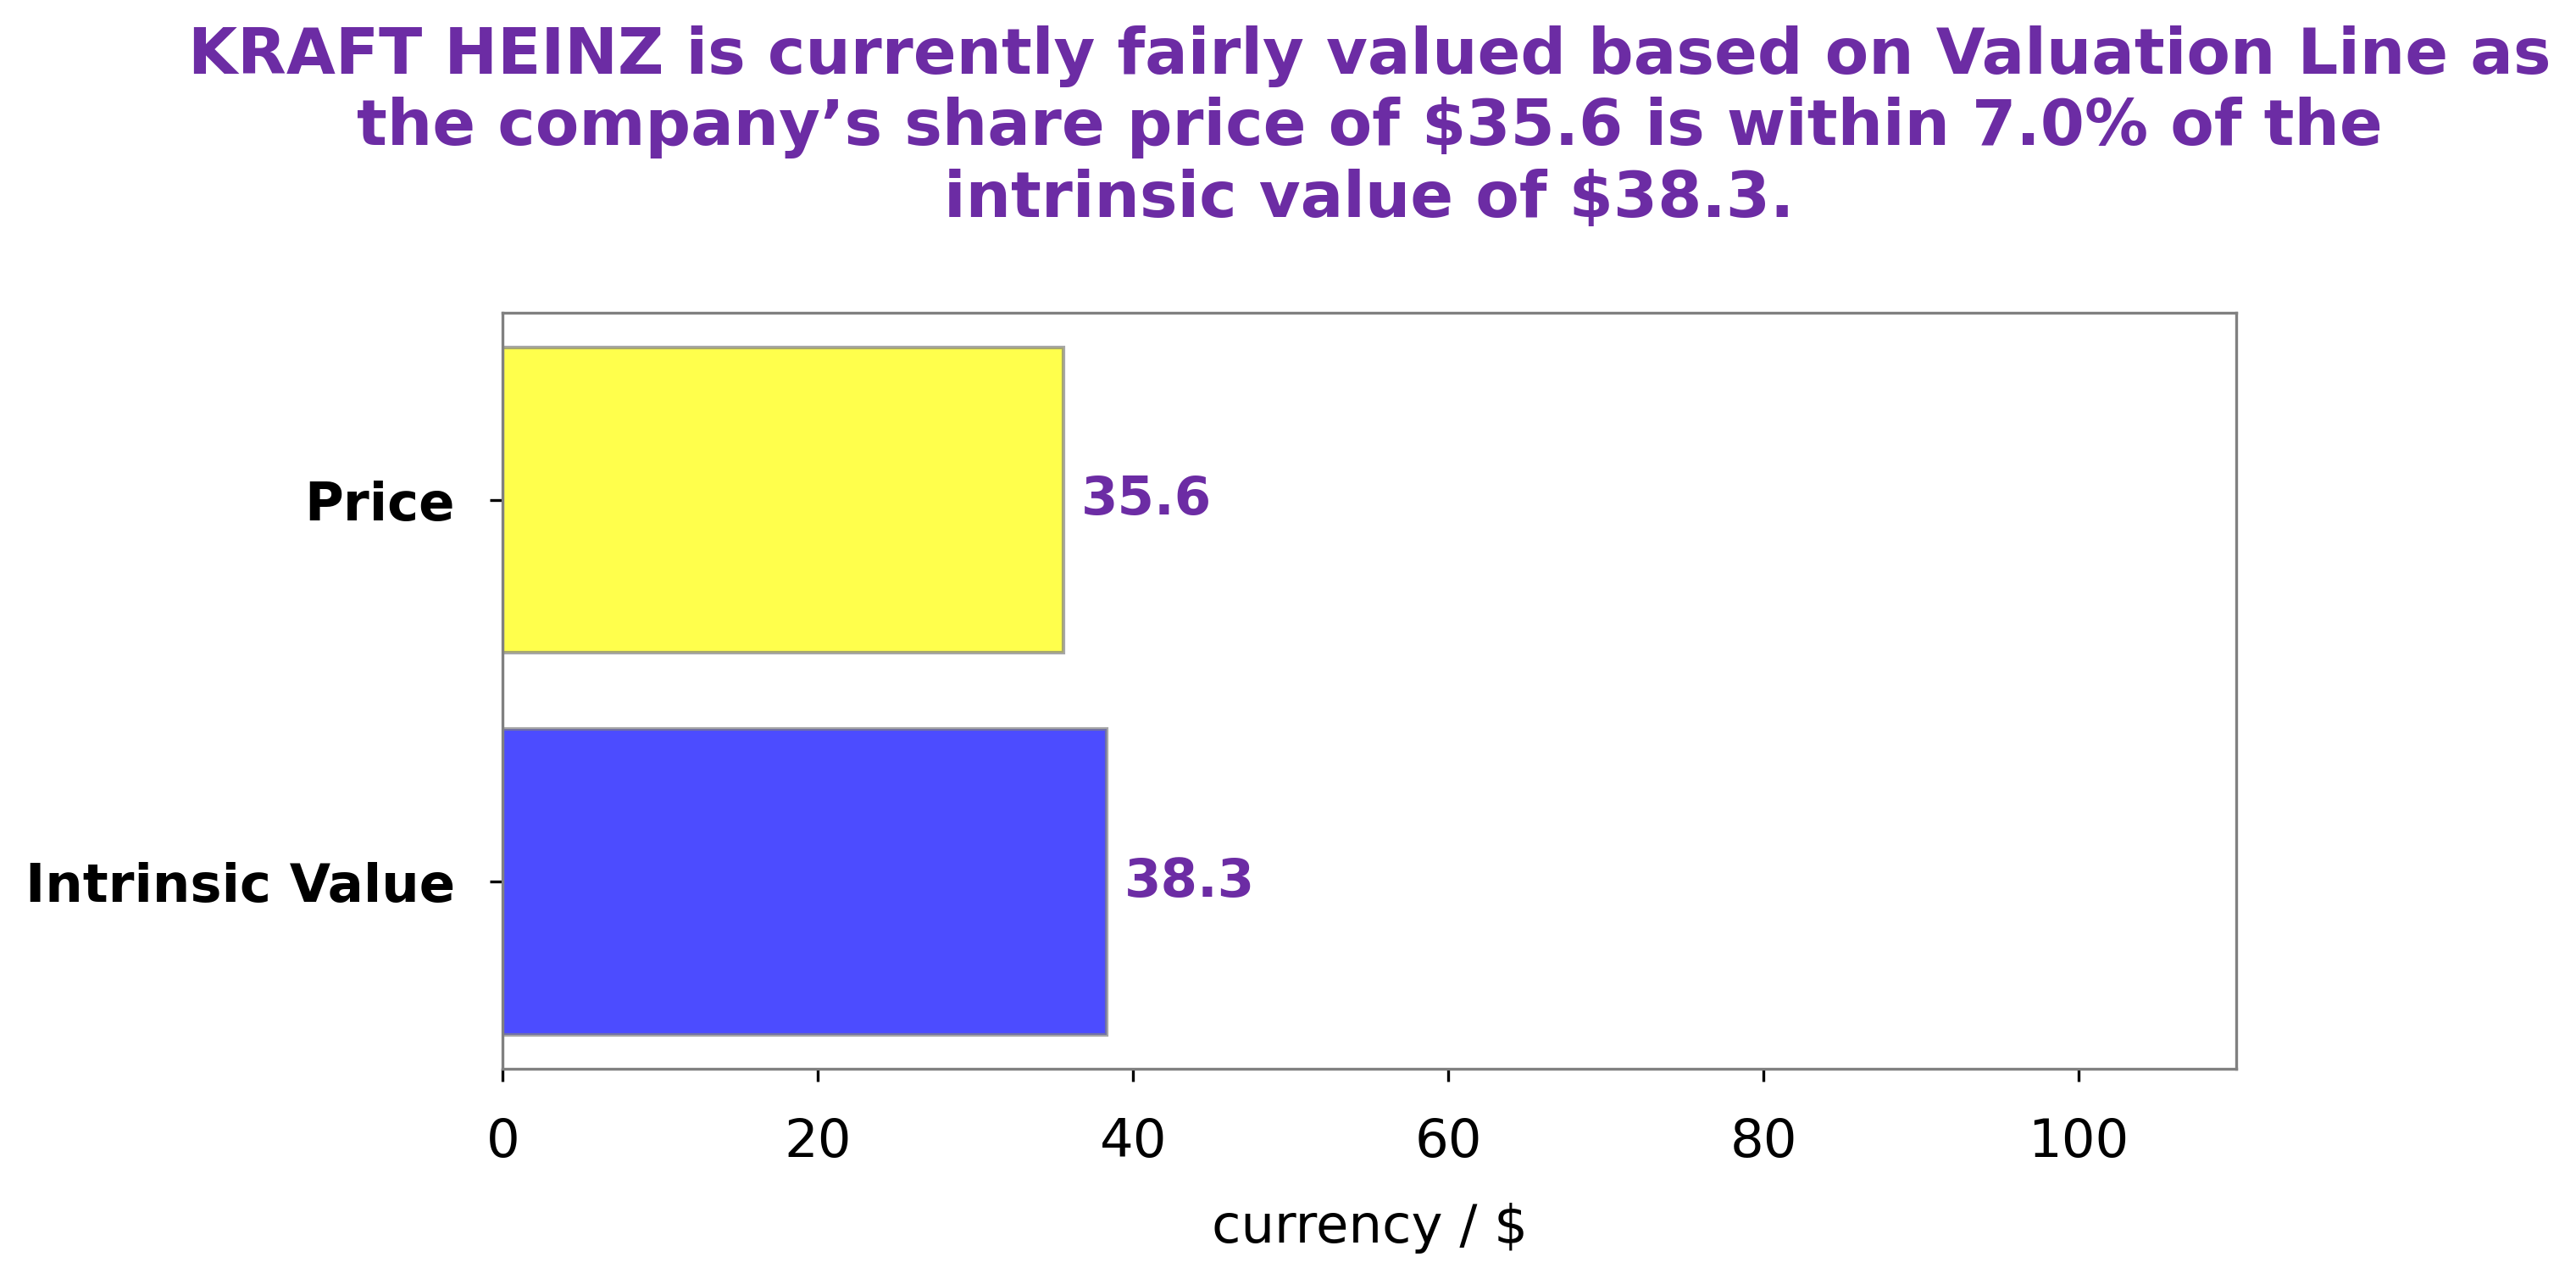
At GoodWhale, we recently conducted an analysis of KRAFT HEINZ‘s financials. After crunching the numbers, our proprietary Valuation Line calculated the intrinsic value of KRAFT HEINZ share to be around $38.4. However, according to the current market conditions, the share is being traded at $36.3, which presents an opportunity for investors as it is a fair price undervalued by 5.6%. More…
Peers
The Kraft Heinz Co. is a food and beverage company that offers a variety of products. Its competitors include Kellogg Co, General Mills Inc, and Treehouse Foods Inc.
– Kellogg Co ($NYSE:K)
Kellogg Co is a food manufacturing company that produces cereal, snacks, and other food products. The company has a market cap of $25.03 billion and a return on equity of 33.71%. Kellogg’s products are sold in more than 180 countries and include brands such as Kellogg’s, Keebler, Pop-Tarts, and Eggo. The company has more than 30,000 employees worldwide.
– General Mills Inc ($NYSE:GIS)
General Mills Inc is a food company that produces and markets branded consumer foods in the United States and internationally. The company’s products include cereals, yogurt, snacks, and baking mixes. General Mills Inc has a market cap of 46.37B as of 2022 and a return on equity of 20.18%. The company’s products are marketed under the brands including Cheerios, Lucky Charms, Nature Valley, and Betty Crocker.
– Treehouse Foods Inc ($NYSE:THS)
Treehouse Foods Inc is a food manufacturing company with a market cap of $2.7 billion as of 2022. The company has a return on equity of 0.58%. Treehouse Foods Inc manufactures and sells packaged foods and beverages in the United States. The company offers canned soups, salad dressings, peanut butter, syrups, and other food products. It also provides infant formula and baby food products; and pet food and pet snacks.
Summary
Kraft Heinz reported strong second quarter results for FY2023, with total revenue increasing by 2.5% on a year-over-year basis. The company reported net income of USD 1000.0 million, which represented an increase of 265.0 million from the same period last year. This positive performance has been indicative of Kraft Heinz’s successful turnaround efforts and their improved strategy execution. Investors should consider Kraft Heinz as a potential addition to their portfolios due to their stable financials and increasing profitability.


