JABIL INC Reports FY2024 Q1 Earnings Results, Ending November 30 2023
December 28, 2023

🌥️Earnings Overview
On December 14 2023, JABIL INC ($NYSE:JBL) released its earnings report for FY2024 Q1, ending November 30 2023. Total revenue for the first quarter was USD 8387.0 million, a 13.0% decline from the same quarter one year prior. Net income also decreased 13.0% year over year to USD 194.0 million.
Price History
The stock opened at $130.1 and closed at $136.4, representing a 13.1% increase from its previous closing price of 120.6. This marked a strong start to the year for JABIL Inc., showing clear evidence of the company’s positive financial performance and outlook. Profit margins also improved significantly compared to the same quarter a year ago, thanks largely to cost cutting measures such as increased automation and outsourcing.
Additionally, JABIL Inc.’s cash balance also increased by 8% over the quarter, demonstrating the company’s ability to prudently manage its finances. Overall, these results were well received by investors and the stock experienced notable gains in response. What’s more, the positive momentum seen in JABIL Inc.’s Q1 earnings could be a sign of things to come, setting expectations for a strong year ahead. Live Quote…
About the Company
Income Snapshot
Below shows the total revenue, net income and net margin for Jabil Inc. More…
| Total Revenues | Net Income | Net Margin |
| 33.45k | 789 | 2.7% |
Cash Flow Snapshot
Below shows the cash from operations, investing and financing for Jabil Inc. More…
| Operations | Investing | Financing |
| 2.02k | -622 | -1.06k |
Balance Sheet Snapshot
Below shows the total assets, liabilities and book value per share for Jabil Inc. More…
| Total Assets | Total Liabilities | Book Value Per Share |
| 19.41k | 16.88k | 19.71 |
Key Ratios Snapshot
Some of the financial key ratios for Jabil Inc are shown below. More…
| 3Y Rev Growth | 3Y Operating Profit Growth | Operating Margin |
| 6.6% | 28.4% | 4.6% |
| FCF Margin | ROE | ROA |
| 3.0% | 35.9% | 5.0% |
Analysis
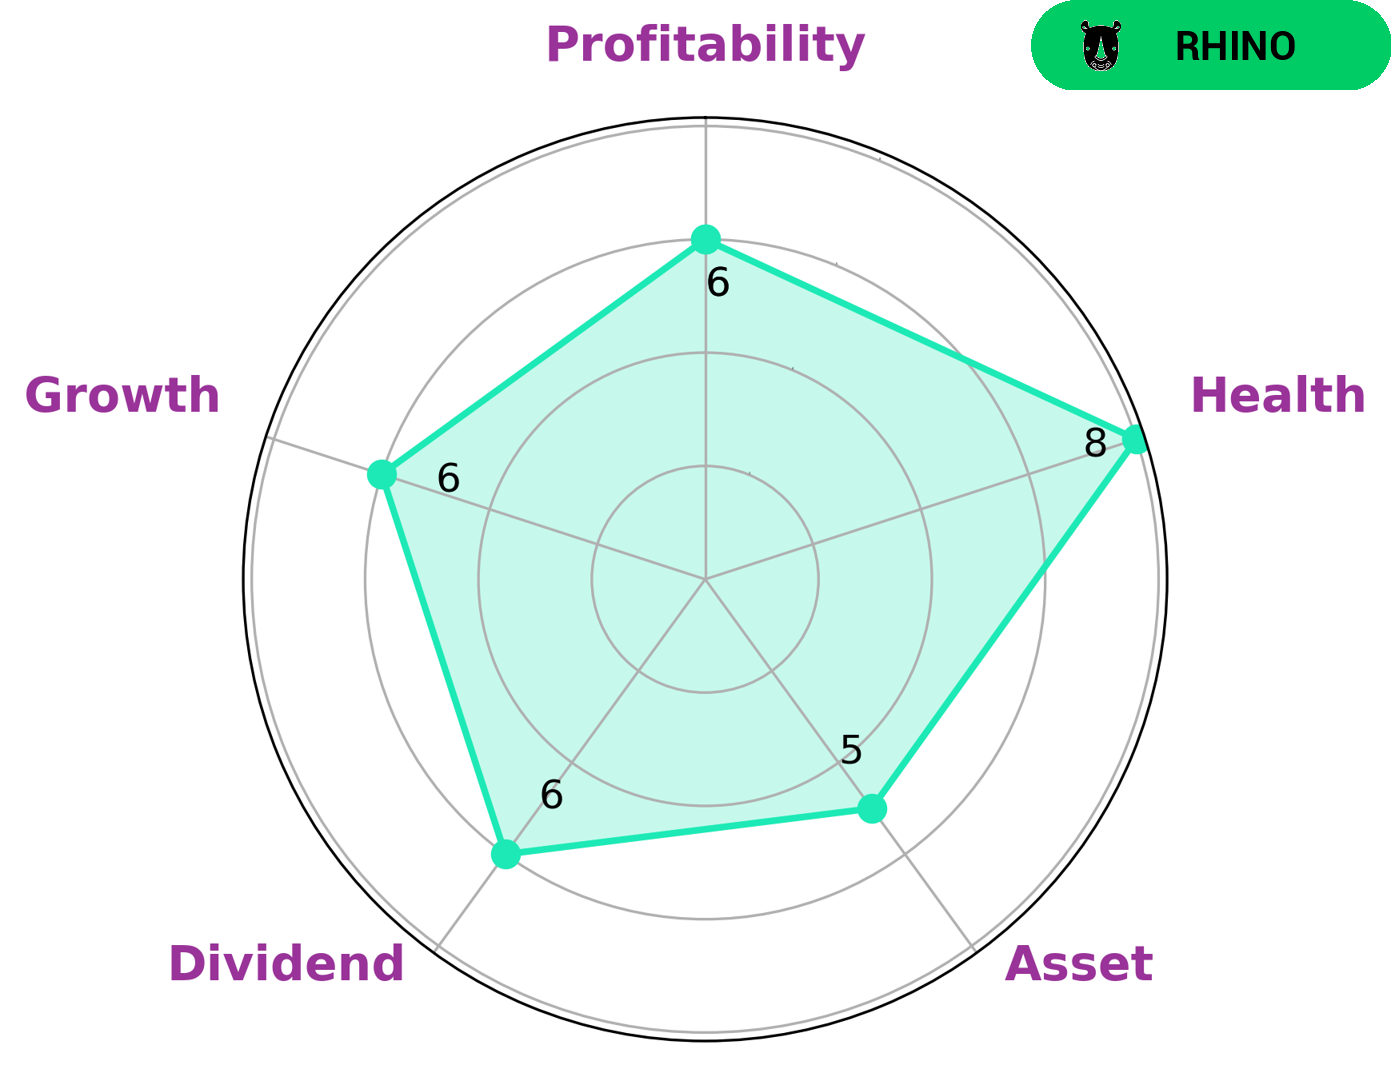
At GoodWhale, we analyze JABIL INC‘s fundamentals to see how the company is performing. We use the Star Chart to evaluate JABIL INC’s health score and it comes out to be 8/10, which is high! This indicates that JABIL INC has strong cashflows and debt that will enable it to safely ride out any crisis without the risk of bankruptcy. JABIL INC is strong in growth, with medium scores in terms of asset, dividend and profitability. Based on this, we classify JABIL INC as a ‘rhino’, a type of company that has achieved moderate revenue or earnings growth. Given JABIL INC’s fundamentals, we believe that investors who are looking for moderate growth investments will be interested in this company. Additionally, investors who are risk-averse may also find JABIL INC to be an attractive investment due to its high health score. More…
Peers
It is headquartered in St. Petersburg, Florida, and it has been in business since 1966. The company has more than 100,000 employees, and its revenue was $17.9 billion in 2017. Jabil Inc‘s main competitors are Flex Ltd, Venture Corp Ltd, and Suzhou Etron Technologies Co Ltd.
– Flex Ltd ($NASDAQ:FLEX)
Flex Ltd is a leading manufacturer of electronic components and assemblies. The company has a market capitalization of 7.97 billion as of 2022 and a return on equity of 18.46%. Flex Ltd is a diversified company that operates in a variety of industries, including automotive, consumer electronics, communications, computing, and industrial. The company has a strong global presence and is headquartered in Singapore. Flex Ltd is a publicly traded company on the Singapore Stock Exchange.
– Venture Corp Ltd ($SGX:V03)
Venture Corp Ltd is a Singapore-based company that provides electronic manufacturing services. The company has a market cap of 4.64B as of 2022 and a Return on Equity of 12.65%. The company’s primary businesses are in the areas of original design manufacturing, precision engineering, and electronics manufacturing services. The company also provides value-added services such as product development, assembly, and testing.
– Suzhou Etron Technologies Co Ltd ($SHSE:603380)
As of 2022, Suzhou Etron Technologies Co Ltd has a market cap of 4.81B and a Return on Equity of 13.48%. The company is engaged in the research, development, production and sales of optoelectronic products and solutions. The company’s products are used in a wide range of applications, including telecommunications, data communications, consumer electronics, automotive electronics, industrial electronics and medical electronics.
Summary
Investors are closely monitoring JABIL INC following the release of the company’s earnings results for Q1 of FY 2023. Total revenue dropped 13.0% year over year to USD 8387.0 million, while net income decreased by 13.0% to USD 194.0 million compared to the same quarter of the prior year. Despite the declines, the stock price moved up, likely due to investors seeing potential for future growth. With the company’s ongoing focus on innovation and cost reduction initiatives, it remains an attractive investment opportunity.
Related Posts


Recent Posts


