IAC INC Reports Earnings Results for FY2023 Q2, As of June 30 2023, on August 8 2023
August 26, 2023

🌥️Earnings Overview
IAC INC ($NASDAQ:IAC) released their earnings results for Q2 of FY 2023, which ended on June 30 2023, on August 8 2023. Total revenue was USD 1111.6 million, a decrease of 18.4% from the same quarter the previous year. However, IAC INC saw a drastic improvement in their net income, which was USD -89.0 million, compared to the prior year’s figure of -869.1 million.
Market Price
On Tuesday, August 8, 2023, IAC INC reported their financial results for the second quarter of fiscal year 2023, ending June 30, 2023. The company’s stock opened the day at $66.1 and closed at $67.1, down by 0.5% from its previous closing price of 67.4. IAC INC’s second quarter earnings report showed an overall increase in revenue from the same period the previous year. The company attributed the growth to an increase in the number of customers and sales of their products and services.
Additionally, IAC INC reported their operating expenses were lower than expected due to cost-cutting measures implemented during the quarter. The company also announced that they had obtained several new contracts with major international companies, which they expect to contribute to their revenue growth in the coming quarters. Overall, IAC INC’s second quarter earnings report was met with positive reactions from investors and analysts alike. The company’s share price increased slightly during Tuesday’s trading session, despite the slight decrease from the previous day’s closing price. It is expected that IAC INC’s stock will continue to trend upwards in the future as the company continues to grow its presence in the market. Live Quote…
About the Company
Income Snapshot
Below shows the total revenue, net income and net margin for Iac Inc. More…
| Total Revenues | Net Income | Net Margin |
| 4.74k | 252.19 | -8.8% |
Cash Flow Snapshot
Below shows the cash from operations, investing and financing for Iac Inc. More…
| Operations | Investing | Financing |
| 53.37 | -296.74 | -242.21 |
Balance Sheet Snapshot
Below shows the total assets, liabilities and book value per share for Iac Inc. More…
| Total Assets | Total Liabilities | Book Value Per Share |
| 10.55k | 3.74k | 71.24 |
Key Ratios Snapshot
Some of the financial key ratios for Iac Inc are shown below. More…
| 3Y Rev Growth | 3Y Operating Profit Growth | Operating Margin |
| -0.7% | – | 9.9% |
| FCF Margin | ROE | ROA |
| -2.5% | 4.7% | 2.8% |
Analysis
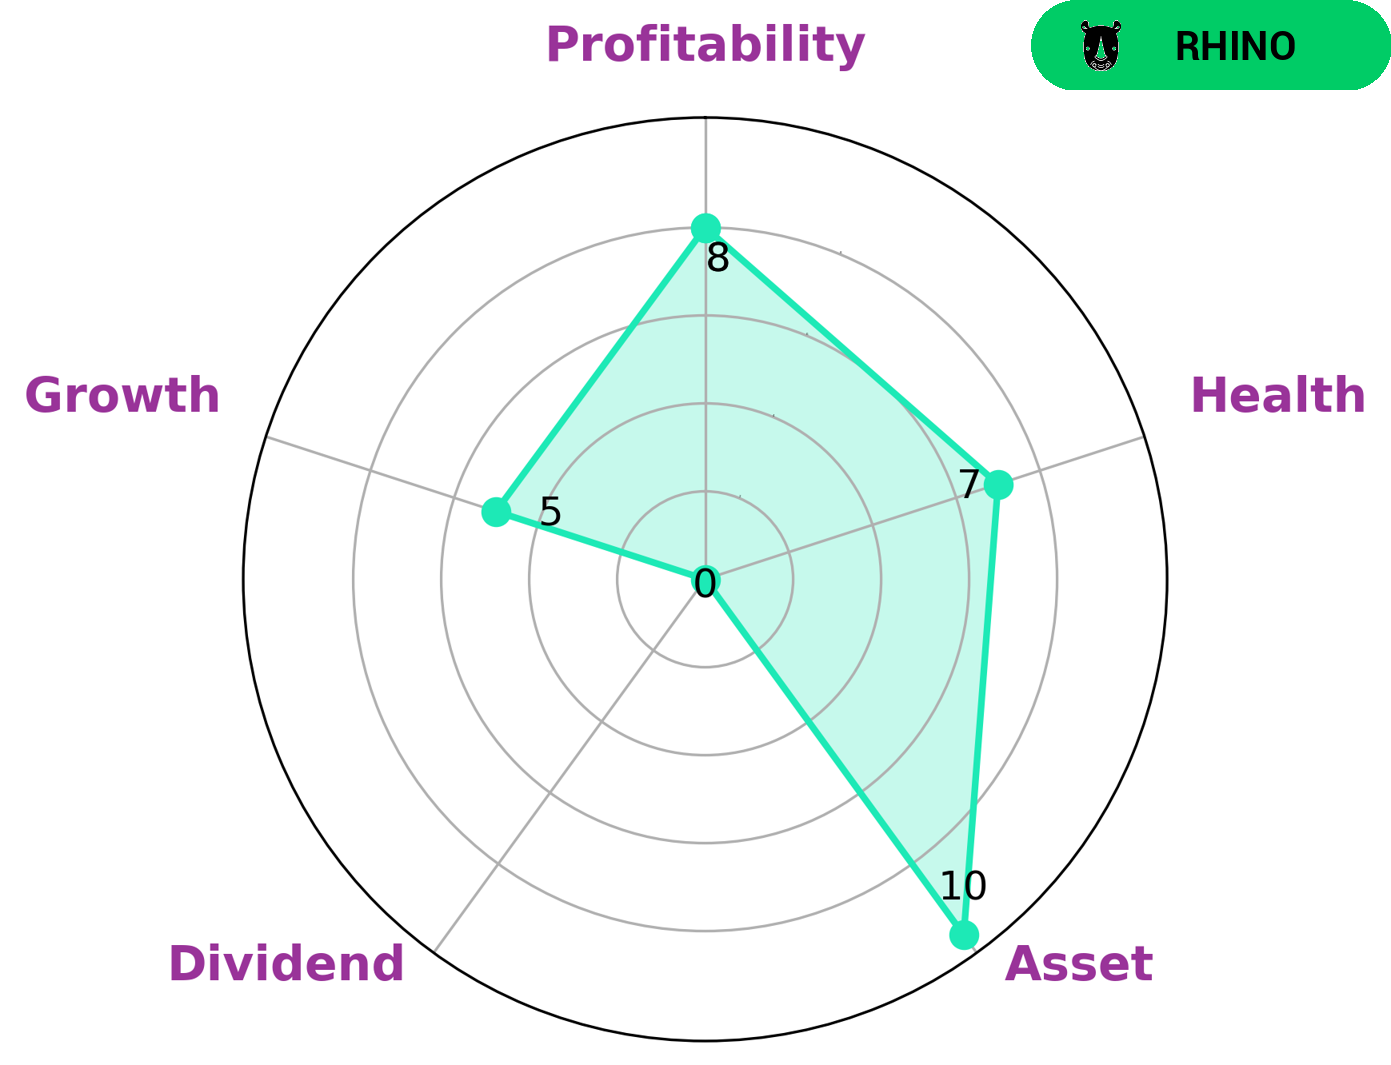
At GoodWhale we have conducted an analysis of IAC INC‘s wellbeing and have identified the company as an ‘elephant’ – a type of company that is rich in assets after deducting off liabilities. IAC INC earned a high health score of 7/10 with regard to its cashflows and debt, meaning that it is capable to safely ride out any crisis without the risk of bankruptcy. Our Star Chart has deemed IAC INC as strong in asset, medium in growth, profitability and weak in dividend. With these ratings it is likely that value investors and those interested in a long-term investment strategy may find IAC INC appealing. However, investors seeking short-term gains or larger dividends may be more hesitant to invest. More…
Peers
IAC/InterActiveCorp is headquartered in New York City.
– Angi Inc ($NASDAQ:ANGI)
As of 2022, Angi Inc’s market cap is 971.35M and its ROE is -5.81%. Angi Inc is a provider of home services that connects consumers with service professionals. The company operates in two segments: HomeAdvisor and Angie’s List. Its HomeAdvisor segment offers a digital marketplace that connects consumers with service professionals for home repair, maintenance, and improvement projects. The Angie’s List segment offers a membership-based website and app that provides consumers with reviews of local service providers.
– Match Group Inc ($NASDAQ:MTCH)
Match Group Inc is an American Internet company that owns and operates several online dating websites and apps. The company has a market cap of 12.02B as of 2022 and a return on equity of -41.93%. Match Group Inc was founded in 1995 and is headquartered in Dallas, Texas. The company offers a variety of online dating services and apps, including Tinder, Hinge, OkCupid, PlentyOfFish, and Match.com.
– InfoSearch Media Inc ($OTCPK:ISHM)
Media Inc has a market cap of 52.49k as of 2022. The company is a provider of information and analysis on the media industry, including traditional and digital media companies.
Summary
Total revenue fell 18.4% year-over-year to USD 1111.6 million. Net income dropped to USD -89.0 million, a substantial improvement from -869.1 million in the prior year period. For investors, this earnings report shows that IAC is recovering from Q2 of the prior fiscal year.
Despite the decrease in overall revenue, the company’s net income has taken a positive turn. This could be an indication of a potential rebound in performance in the upcoming quarters.
Related Posts


Recent Posts


