HUBSPOT Reports Strong Financial Results for Q2 of FY2023
August 28, 2023

☀️Earnings Overview
On August 2 2023, HUBSPOT ($NYSE:HUBS) reported financial results for the quarter ending June 30 2023. The company showed a total revenue of USD 529.1 million, which was 25.5% higher than the same period last year. Net income was USD -119.0 million, which was more than twice the loss of -56.4 million from the prior year.
Share Price
On Wednesday, HUBSPOT reported strong financial results for the second quarter of fiscal year 2023. The company released positive revenue figures which showed accelerated growth for the quarter. At the beginning of the day, HUBSPOT stock opened at $569.4 but closed at $553.2, down by 4.0% from its previous closing price of $576.4.
Despite the slight decrease in stock price, HUBSPOT showed impressive earnings results and investors were encouraged by its performance. Overall, HUBSPOT demonstrated that it had a successful second quarter and it looks to continue the momentum in future quarters. Live Quote…
About the Company
Income Snapshot
Below shows the total revenue, net income and net margin for Hubspot. HUBSPOT_Reports_Strong_Financial_Results_for_Q2_of_FY2023″>More…
| Total Revenues | Net Income | Net Margin |
| 1.94k | -204.28 | -7.7% |
Cash Flow Snapshot
Below shows the cash from operations, investing and financing for Hubspot. HUBSPOT_Reports_Strong_Financial_Results_for_Q2_of_FY2023″>More…
| Operations | Investing | Financing |
| 307.64 | -196.96 | 36.88 |
Balance Sheet Snapshot
Below shows the total assets, liabilities and book value per share for Hubspot. HUBSPOT_Reports_Strong_Financial_Results_for_Q2_of_FY2023″>More…
| Total Assets | Total Liabilities | Book Value Per Share |
| 2.73k | 1.65k | 21.72 |
Key Ratios Snapshot
Some of the financial key ratios for Hubspot are shown below. HUBSPOT_Reports_Strong_Financial_Results_for_Q2_of_FY2023″>More…
| 3Y Rev Growth | 3Y Operating Profit Growth | Operating Margin |
| 36.6% | – | -9.3% |
| FCF Margin | ROE | ROA |
| 11.2% | -10.6% | -4.1% |
Analysis
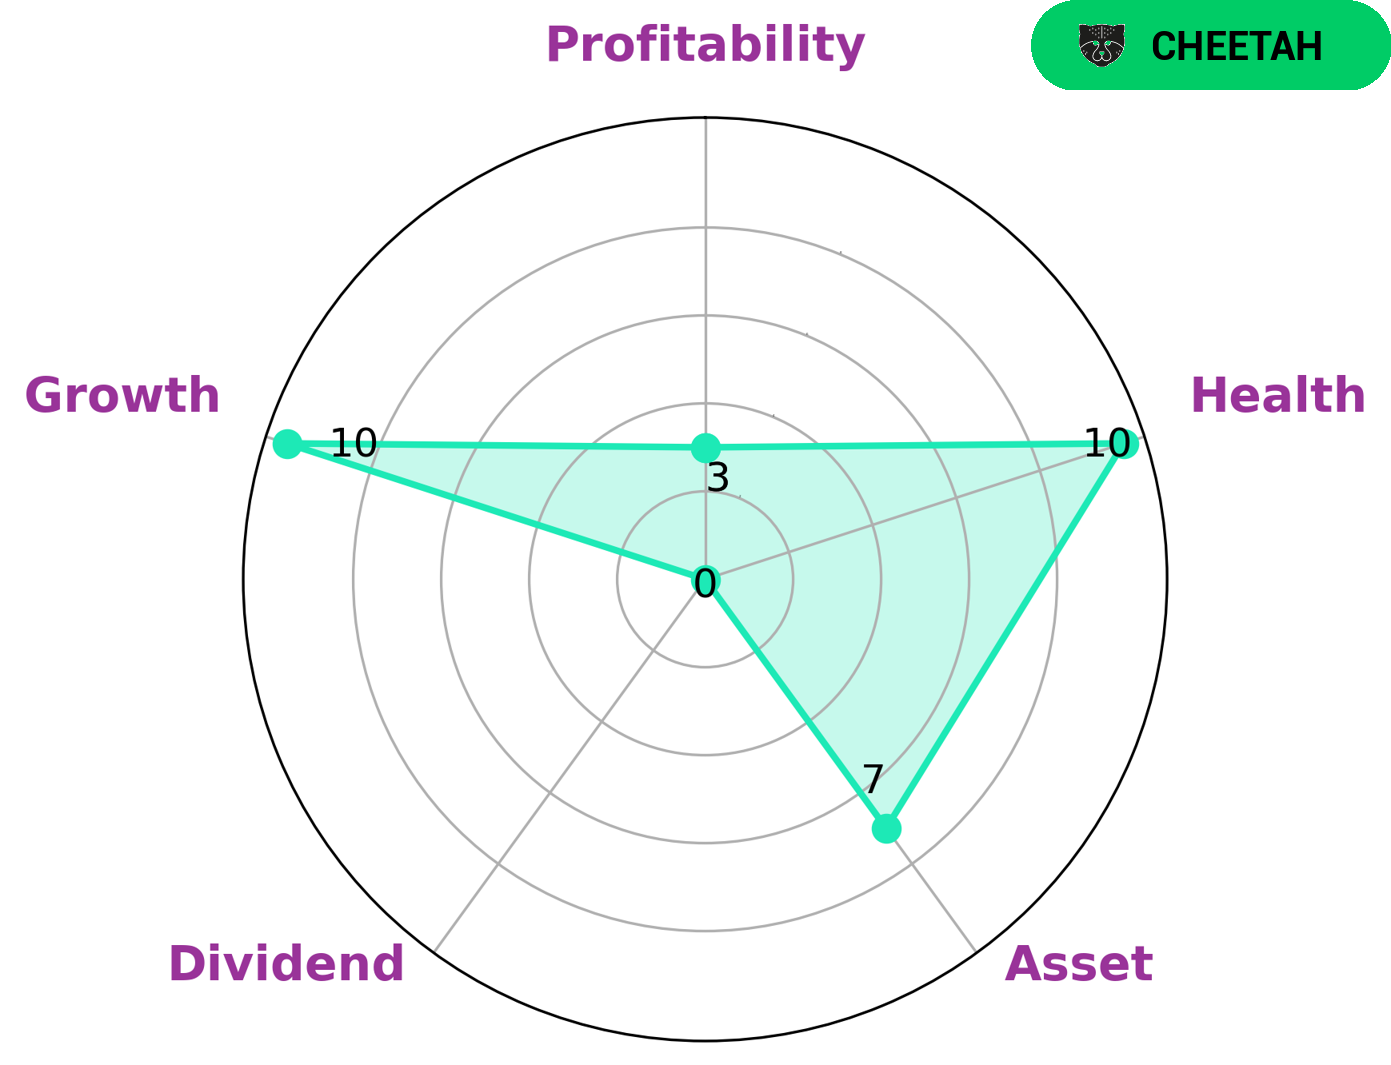
At GoodWhale, we have conducted an analysis of HUBSPOT‘s wellbeing. According to our Star Chart, HUBSPOT is classified as a ‘cheetah’, a company that has achieved rapid revenue or earnings growth but is deemed a higher risk investment due to its lower profitability. This type of company may be attractive to investors focused on capital appreciation or aggressive growth strategies. The analysis of HUBSPOT revealed that the company is strong in asset and growth, yet weak in dividend and profitability. Despite this, it scored a high health score of 10/10. This indicates that it is capable of paying off debt and funding future operations through its positive cash flow. More…
Peers
HubSpot Inc. is an American company that specializes in providing software for inbound marketing and sales. HubSpot was founded in 2006 by Brian Halligan and Dharmesh Shah. KwikClick Inc, Wishpond Technologies Ltd, Salesforce Inc are all companies that compete with HubSpot.
– KwikClick Inc ($OTCPK:KWIK)
KwikClick Inc is a publicly traded company with a market capitalization of 280.32 thousand US dollars as of 2022. The company provides software solutions that enable businesses to automate their processes and improve their efficiency.
– Wishpond Technologies Ltd ($TSXV:WISH)
Wishpond Technologies Ltd is a technology company that provides software as a service (SaaS) solutions for businesses. The company offers marketing automation, lead capture, and CRM solutions. Wishpond Technologies Ltd has a market cap of 40.77M as of 2022 and a return on equity of -29.17%. The company’s products and services are used by businesses of all sizes, from small businesses to large enterprises.
– Salesforce Inc ($NYSE:CRM)
Salesforce is a cloud-based CRM software company. It was founded in 1999, and its headquarters are in San Francisco, California. The company went public in 2004, and today it has a market cap of $153.67B. Salesforce’s primary product is its customer relationship management (CRM) software, which helps businesses manage sales, marketing, customer service, and commerce. The company also offers a number of other enterprise software products, including Salesforce Platform, SalesforceIQ, and Salesforce Einstein.
Summary
Investors in HubSpot’s stock may have been disappointed in the company’s second quarter of FY2023 financial results. Total revenue of USD 529.1 million was a 25.5% increase from the same period in the prior year, but reported net income of USD -119.0 million was much worse than the USD -56.4 million loss in the same quarter last year. This decrease in net income caused the stock price to move down on August 2, 2023. Moving forward, investors will want to keep an eye on HubSpot’s financials and revisit their investment decisions accordingly.
Related Posts


Recent Posts


