Hormel Foods Stock Fair Value Calculation – HORMEL FOODS Reports Third Quarter Earnings Results for FY2023
September 6, 2023

🌥️Earnings Overview
For the third quarter of FY2023, Hormel Foods ($NYSE:HRL) reported total revenue of USD 2963.3 million, a decrease of 2.3% compared to the same period in the previous year. Additionally, the company’s net income was USD 162.7 million, a decrease of 25.7% year-over-year.
Market Price
HORMEL FOODS reported its earnings results for the third quarter of FY2023 on Thursday, with stock prices opening at $39.6 and closing at $38.6. This represents a 2.7% decrease from the previous closing price of 39.7. Despite the downward trend, the company posted strong results and delivered a positive earnings report that exceeded market expectations. This was driven by higher margins and the company’s ability to effectively manage costs and increase efficiency.
HORMEL FOODS is continuing to focus on bringing innovation to its product portfolio and expanding its presence in the retail space, as well as exploring new investment opportunities that will strengthen the company going into the future. The company’s leadership team remains focused on providing value to shareholders and delivering strong financial results for FY2023 and beyond. Live Quote…
About the Company
Income Snapshot
Below shows the total revenue, net income and net margin for Hormel Foods. More…
| Total Revenues | Net Income | Net Margin |
| 12.2k | 877.52 | 7.2% |
Cash Flow Snapshot
Below shows the cash from operations, investing and financing for Hormel Foods. More…
| Operations | Investing | Financing |
| 1.1k | -674.7 | -593.2 |
Balance Sheet Snapshot
Below shows the total assets, liabilities and book value per share for Hormel Foods. More…
| Total Assets | Total Liabilities | Book Value Per Share |
| 13.43k | 5.71k | 14.12 |
Key Ratios Snapshot
Some of the financial key ratios for Hormel Foods are shown below. More…
| 3Y Rev Growth | 3Y Operating Profit Growth | Operating Margin |
| 8.0% | 0.4% | 9.8% |
| FCF Margin | ROE | ROA |
| 6.9% | 9.7% | 5.6% |
Analysis – Hormel Foods Stock Fair Value Calculation
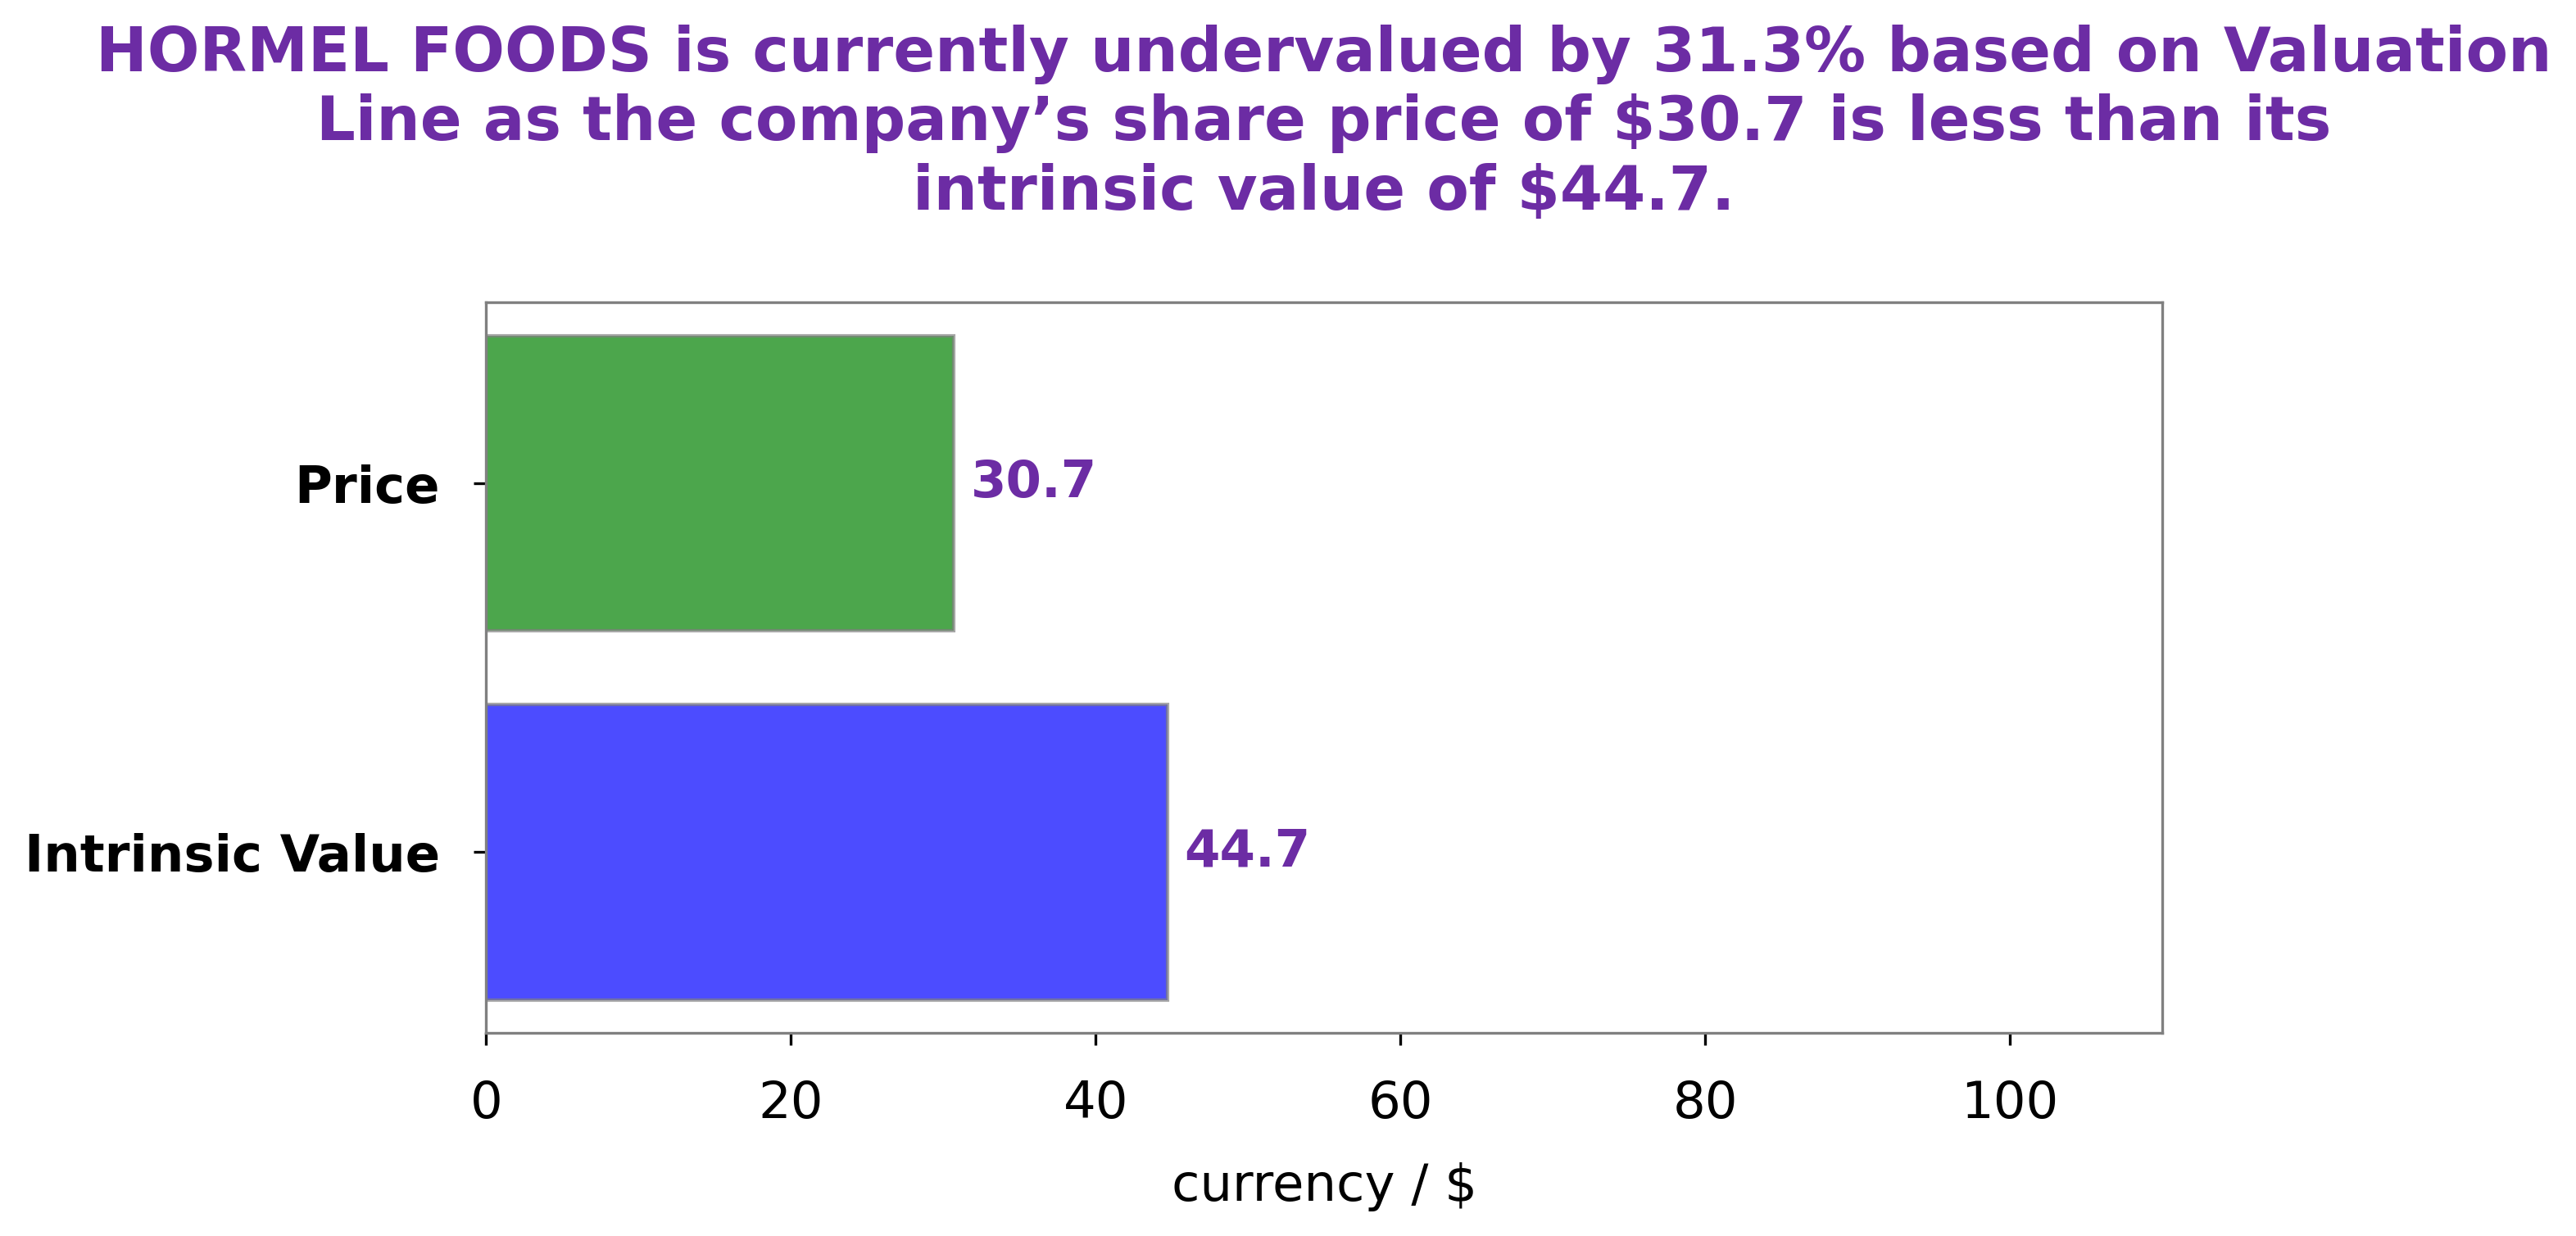
At GoodWhale, we recently conducted an analysis of HORMEL FOODS‘s wellbeing. After careful consideration, we found that the intrinsic value of the company’s shares is approximately $49.0, which we calculated using our proprietary Valuation Line. Currently, however, the stock is trading at $38.6, which is 21.2% lower than its intrinsic value. This indicates that there may be a good opportunity for potential investors to buy at a discounted rate. More…
Peers
In the food industry, Hormel Foods Corp competes with JM Smucker Co, Fleury Michon, and Bell Food Group Ltd. These companies all produce similar products, so the competition is fierce. Hormel Foods Corp has an advantage because it is a well-established company with a strong brand.
– JM Smucker Co ($NYSE:SJM)
The J. M. Smucker Company has a market capitalization of $15.24 billion as of March 2022 and a return on equity of 7.19%. The company manufactures and markets branded food and beverage products in North America and internationally. Its products include coffee, peanut butter, shortening and oils, ice cream toppings, fruit spreads, syrups, and frozen desserts. The company was founded in 1879 and is headquartered in Orrville, Ohio.
– Fleury Michon ($LTS:0J75)
Fleury Michon is a French company that specializes in the production of prepared foods. The company has a market cap of 79.9 million as of 2022 and a return on equity of 1.6%. Fleury Michon is a publicly traded company listed on the Euronext Paris stock exchange. The company was founded in 1887 and is headquartered in Vire, France.
– Bell Food Group Ltd ($LTS:0RFX)
BFG Ltd’s market cap is 1.43B as of 2022 and has a ROE of 7.15%. The company is a food group that manufactures and supplies food products. It offers a range of products including meat, poultry, fish, vegetables, and desserts. The company has a strong presence in the UK and Ireland, with a network of over 30 manufacturing sites and a workforce of around 23,000 people.
Summary
This paints a picture of decreased revenue and profitability for Hormel Foods, as investors may be worried about the company’s future performance. Despite what appears to be negative news, further analysis may be needed to truly understand the implications of this data and determine if Hormel Foods is a good investment opportunity. Key metrics such as current and future market trends, customer loyalty, competitive positioning, and cost management should all be evaluated before making any decisions.


