GO Intrinsic Value Calculator – GROCERY OUTLET HOLDING Reports Q2 FY2023 Earnings Results for June 30, 2023
August 28, 2023

🌥️Earnings Overview
On August 8 2023, GROCERY OUTLET HOLDING ($NASDAQ:GO) announced its earnings results for the second quarter of FY2023, ending on June 30 2023. Total revenue rose 12.5% year-on-year to USD 1010.3 million, and net income increased 21.8% year-on-year to USD 24.5 million.
Stock Price
On Tuesday, GROCERY OUTLET HOLDING released their Q2 FY2023 earnings results for the quarter ending June 30, 2023. The stock opened at $33.2 before closing at $33.1, a 0.2% decrease from the previous closing price of 33.2. GROCERY OUTLET HOLDING continues to be successful, despite challenges posed by the current pandemic.
The company is committed to leveraging its robust supply chain, digital capabilities, and customer loyalty program to drive long-term growth and create value for shareholders. Looking ahead, investors can expect to see further expansion of the company’s popular store concepts and continued investments in its e-commerce platforms. Live Quote…
About the Company
Income Snapshot
Below shows the total revenue, net income and net margin for GO. More…
| Total Revenues | Net Income | Net Margin |
| 3.82k | 71.58 | 2.0% |
Cash Flow Snapshot
Below shows the cash from operations, investing and financing for GO. More…
| Operations | Investing | Financing |
| 257.9 | -162.64 | -91.96 |
Balance Sheet Snapshot
Below shows the total assets, liabilities and book value per share for GO. More…
| Total Assets | Total Liabilities | Book Value Per Share |
| 2.82k | 1.66k | 11.79 |
Key Ratios Snapshot
Some of the financial key ratios for GO are shown below. More…
| 3Y Rev Growth | 3Y Operating Profit Growth | Operating Margin |
| 10.0% | 9.4% | 3.0% |
| FCF Margin | ROE | ROA |
| 2.5% | 6.3% | 2.6% |
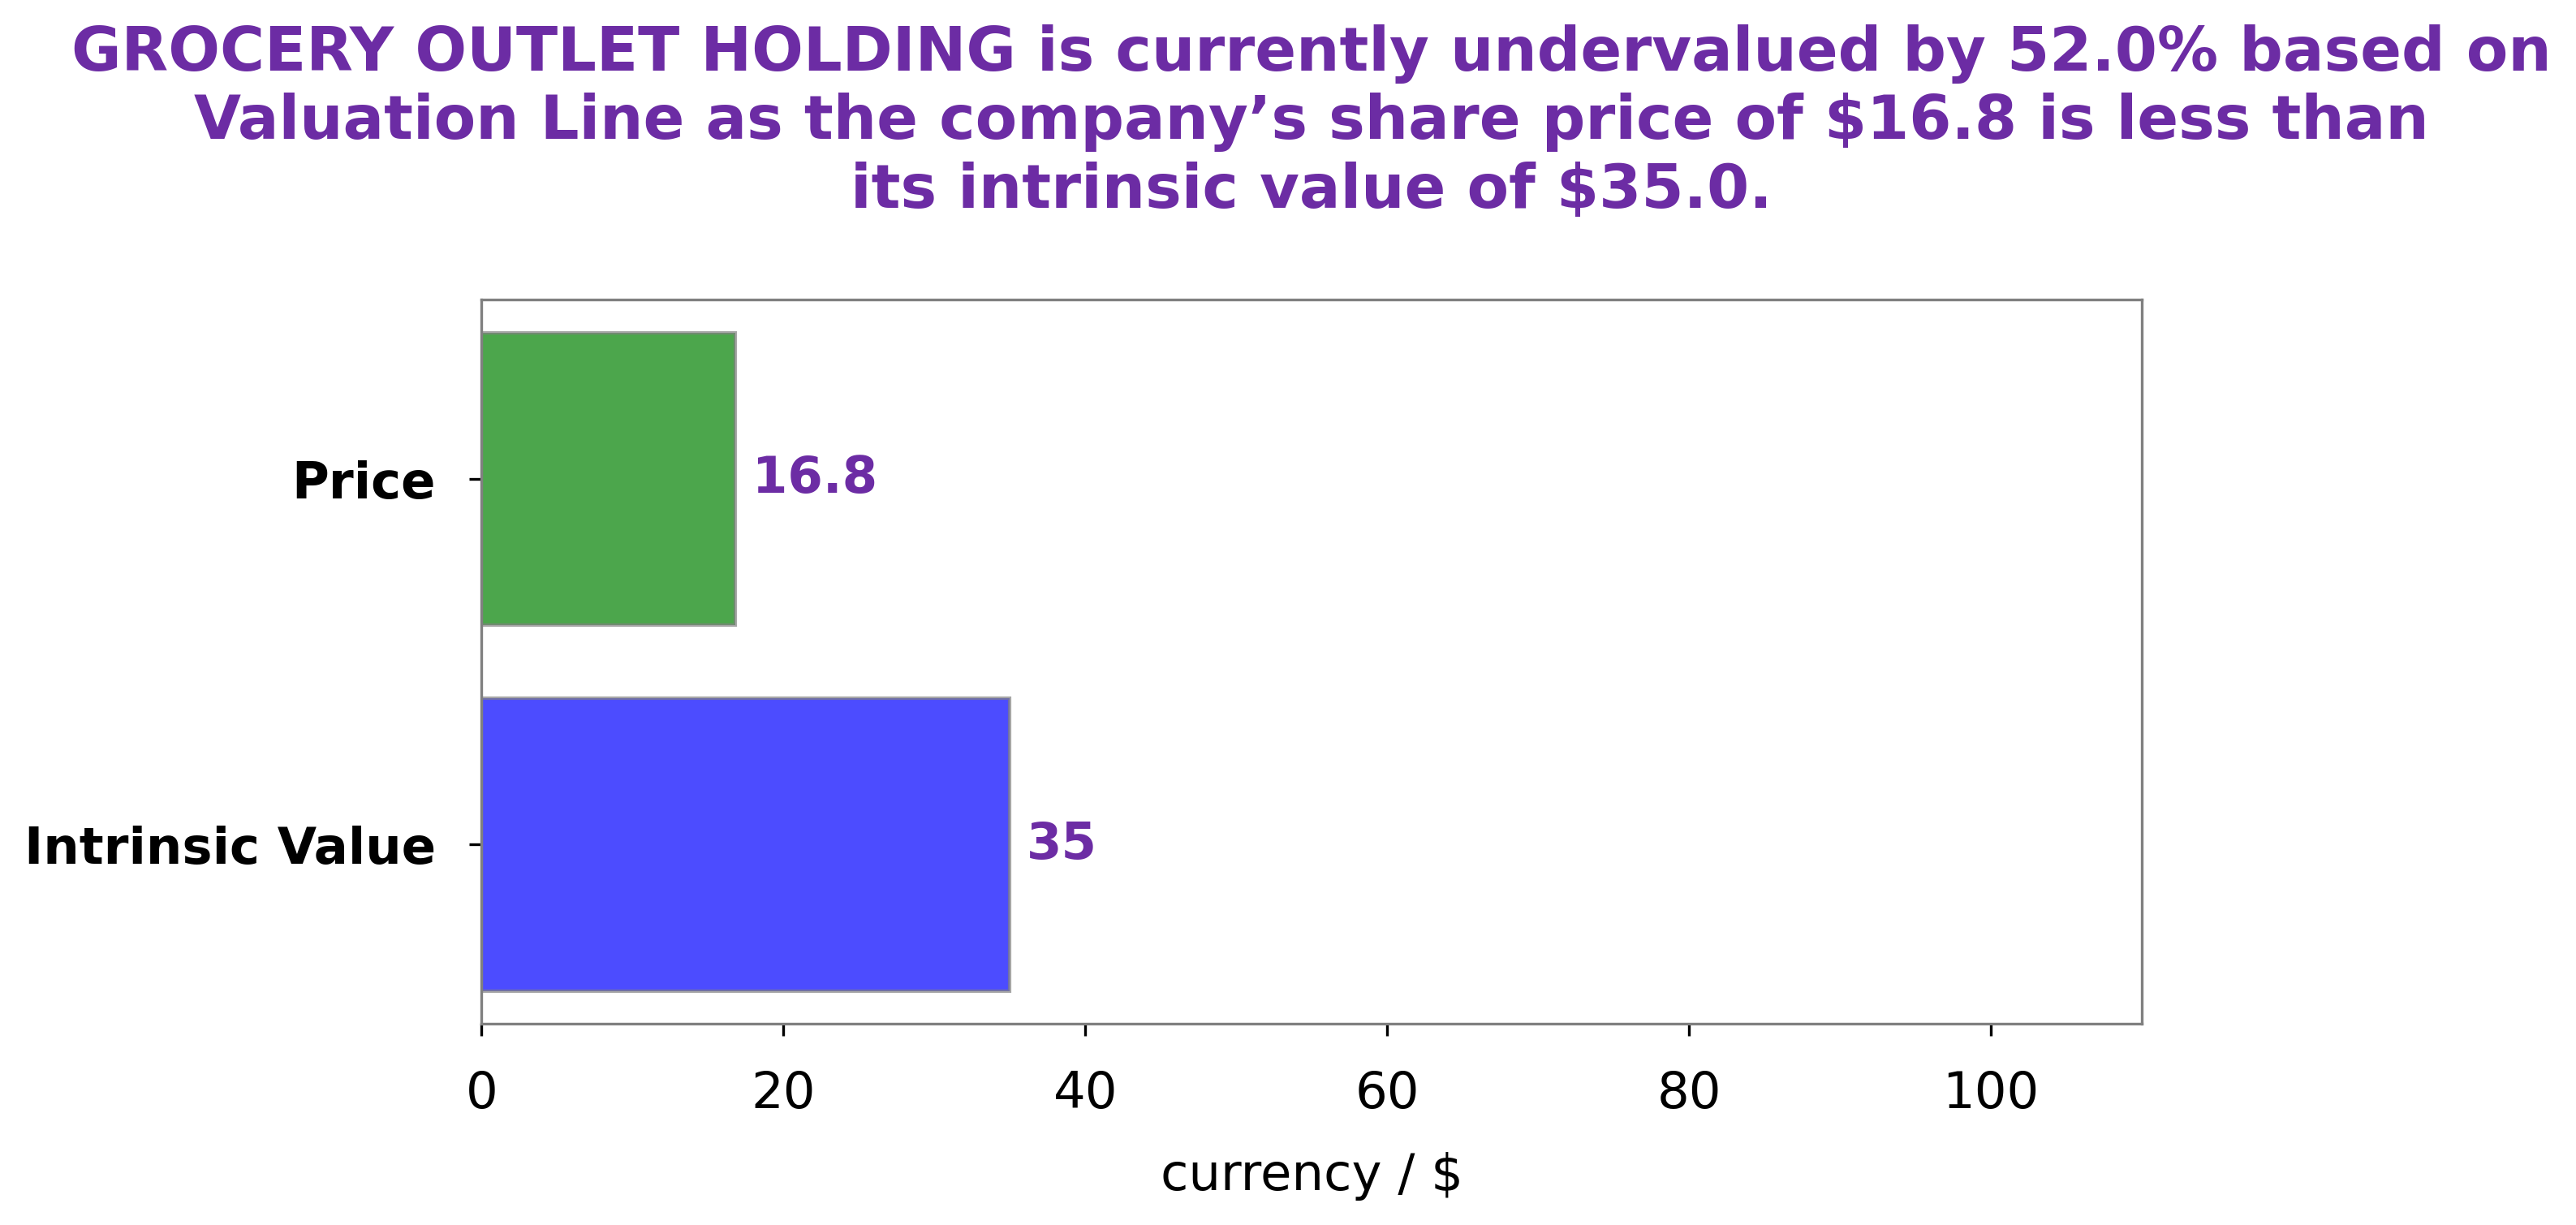
Analysis – GO Intrinsic Value Calculator
At GoodWhale, we analyzed GROCERY OUTLET HOLDING’s financials and calculated its intrinsic value to be around $37.4. This is based on our proprietary Valuation Line, which takes into account a broad range of financial metrics. Currently, GROCERY OUTLET HOLDING stock is trading at $33.1, which means it is undervalued by 11.6%. This provides an opportunity for investors to buy the stock at a fair price. More…
Peers
The company was founded in 1946 and is headquartered in Emeryville, California. Grocery Outlet Holding Corp operates through two segments: Grocery Outlet and Bargain Market. The Grocery Outlet segment offers a variety of food and household products at discounts of up to 50% off traditional grocery store prices. The Bargain Market segment offers a selection of closeout, overstocked, and irregular merchandise at discounts of up to 70% off traditional retail prices. The company competes with Veroni Brands Corp, The Kroger Co, and Ollie’s Bargain Outlet Holdings Inc.
– Veroni Brands Corp ($OTCPK:VONI)
As of 2022, Veroni Brands Corp has a market cap of 47.4M. The company’s return on equity is 98.41%. Veroni Brands Corp is a food and beverage company that manufactures and markets a variety of food and beverage products. The company’s products include pasta, sauces, snacks, and desserts. Veroni Brands Corp is headquartered in New York, New York.
– The Kroger Co ($NYSE:KR)
The Kroger Co has a market cap of 33.33B as of 2022, a Return on Equity of 23.61%. The company is a leading grocery store chain in the United States with over 2,800 stores in 35 states. The company offers a wide variety of products and services including grocery, health and beauty, and general merchandise. Kroger also has a strong online presence with a website and mobile app that offer convenient shopping options for customers.
– Ollie’s Bargain Outlet Holdings Inc ($NASDAQ:OLLI)
Ollie’s Bargain Outlet Holdings Inc is a publicly traded company with a market cap of 3.37B as of 2022. The company operates a chain of closeout retail stores in the United States. As of February 2021, the company operated 259 stores in 27 states. The company was founded in 1982 and is headquartered in Harrisburg, Pennsylvania.
Summary
GROCERY OUTLET HOLDING had a strong second quarter of FY2023, with total revenue rising 12.5% year-over-year to USD 1010.3 million and net income increasing 21.8% to USD 24.5 million. This is a positive sign for potential investors, indicating that the company’s operations are continuing to grow and perform well. GROCERY OUTLET HOLDING has also seen an increase in its stock price over the past year, which may indicate that the market is optimistic about its future prospects. With a strong balance sheet and sustained growth, GROCERY OUTLET HOLDING appears to be an attractive investment opportunity.


