GLOBALFOUNDRIES INC Reports FY2023 Q2 Earnings Results on August 9, 2023
August 22, 2023

🌥️Earnings Overview
On August 9 2023, GLOBALFOUNDRIES INC ($NASDAQ:GFS) reported its financial results for the second quarter of FY2023, ending June 30 2023. The company’s total revenue for this period was USD 1845.0 million, a 7.4% decrease from the same quarter of the previous fiscal year. Additionally, net income decreased 9.1% year-on-year and amounted to USD 240.0 million.
Price History
On Wednesday August 9, 2023, GLOBALFOUNDRIES INC reported their fiscal year 2023 second quarter earnings results. The stock opened at $59.7 and closed at $59.2, representing a 1.5% drop from its previous closing price of $60.1. This decrease in the stock price was likely due to the fact that the earnings report was slightly lower than expected. Despite the slightly lower than expected results, GLOBALFOUNDRIES INC remains optimistic about their future prospects due to their strong financial position and their wide array of product offerings.
Going forward, the company plans to focus on expanding their customer base and improving their overall operational efficiency in order to remain competitive in the market. The earnings report will be closely watched by investors as it provides insight into the company’s performance and future prospects. By focusing on improving their financial performance and expanding their customer base, GLOBALFOUNDRIES INC hopes to meet or exceed expectations for the rest of the fiscal year. Live Quote…
About the Company
Income Snapshot
Below shows the total revenue, net income and net margin for Globalfoundries Inc. More…
| Total Revenues | Net Income | Net Margin |
| 7.86k | 1.5k | 15.6% |
Cash Flow Snapshot
Below shows the cash from operations, investing and financing for Globalfoundries Inc. More…
| Operations | Investing | Financing |
| 2.19k | -3.29k | 446 |
Balance Sheet Snapshot
Below shows the total assets, liabilities and book value per share for Globalfoundries Inc. More…
| Total Assets | Total Liabilities | Book Value Per Share |
| 17.82k | 7.24k | 19.05 |
Key Ratios Snapshot
Some of the financial key ratios for Globalfoundries Inc are shown below. More…
| 3Y Rev Growth | 3Y Operating Profit Growth | Operating Margin |
| 11.7% | – | 21.5% |
| FCF Margin | ROE | ROA |
| -8.4% | 10.2% | 5.9% |
Analysis
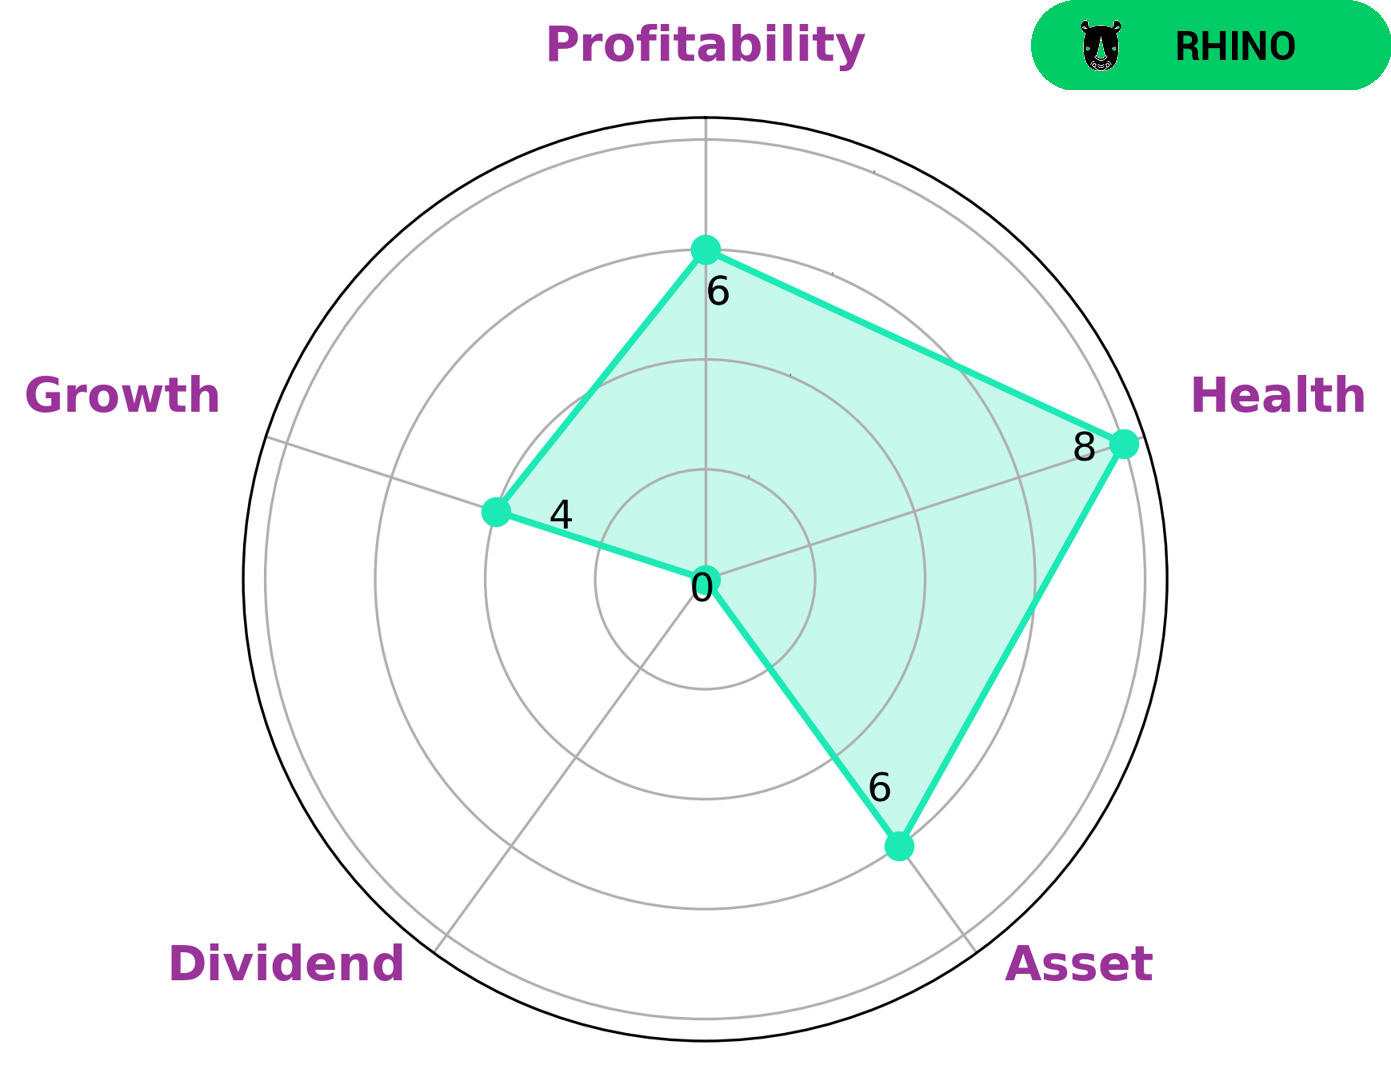
GoodWhale recently performed an analysis of GLOBALFOUNDRIES INC‘s wellbeing. Hence, investors interested in this type of company should be aware of this risk. We further assessed GLOBALFOUNDRIES INC’s financials and determined that it is strong in liquidity, medium in asset, growth, profitability, and weak in dividend. Despite this, its health score was an impressive 8/10, suggesting that the company is capable to safely ride out any crisis without the risk of bankruptcy. More…
Peers
With the technological advances in the semiconductor industry, the competition between foundries has become increasingly fierce. GLOBALFOUNDRIES Inc, a leading foundry company, has been locked in a battle with its competitors, Advanced Micro Devices Inc, Taiwan Semiconductor Manufacturing Co Ltd, and Intel Corp. In order to maintain its competitive edge, GLOBALFOUNDRIES has made significant investments in cutting-edge manufacturing technologies and has been aggressively expanding its production capacity.
– Advanced Micro Devices Inc ($NASDAQ:AMD)
Advanced Micro Devices, Inc. (AMD) is an American multinational semiconductor company based in Santa Clara, California, that develops computer processors and related technologies for business and consumer markets. AMD’s main products include microprocessors, motherboard chipsets, embedded processors and graphics processors for servers, workstations and personal computers, and embedded systems applications.
As of 2022, AMD has a market cap of $93.57 billion and a return on equity (ROE) of 4.13%. The company’s products are used in a variety of electronic devices, including personal computers, game consoles, and servers. AMD is a leading supplier of microprocessor technology for the PC market.
– Taiwan Semiconductor Manufacturing Co Ltd ($TWSE:2330)
Taiwan Semiconductor Manufacturing Co Ltd is a semiconductor foundry. The company has a market cap of 10.29T as of 2022 and a Return on Equity of 22.34%. Taiwan Semiconductor Manufacturing Co Ltd is the world’s largest dedicated semiconductor foundry and one of the largest fabless semiconductor companies. The company offers a comprehensive set of IC design enablement tools, libraries, IPs, design services, advanced packaging, test and yield optimization solutions to help customers accelerate time-to-market.
– Intel Corp ($NASDAQ:INTC)
Intel Corp. is an American multinational corporation and technology company headquartered in Santa Clara, California, in the Silicon Valley. It is the world’s largest and highest valued semiconductor chip manufacturer based on revenue and is the inventor of the x86 series of microprocessors, the processors found in most personal computers (PCs). Intel supplies processors for computer system manufacturers such as Apple, Lenovo, HP, and Dell. Intel also manufactures motherboard chipsets, network interface controllers and integrated circuits, flash memory, graphics chips, embedded processors and other devices related to communications and computing.
The company’s market cap is $108.48B as of 2022 and has a return on equity of 19.16%. Intel Corp is a technology company that designs and manufactures computer processors and other components. The company is headquartered in Santa Clara, California, in the Silicon Valley.
Summary
GlobalFoundries Inc. reported a decrease in both revenue and net income for their fiscal year 2023 Q2, ending on June 30 2023. Total revenue was down 7.4% year over year to USD 1845.0 million, while net income decreased by 9.1% to USD 240.0 million. Investors should consider the overall financial health of the company when deciding to invest in GLOBALFOUNDRIES INC. Analysts should look to the company’s future performance, future outlook, and past performance when assessing potential investments in the company.
Additionally, investors should examine any upcoming contracts, financial resources available, and management expertise before investing in the company.
Related Posts


Recent Posts


