FIVE BELOW Reports Strong Q2 Earnings for FY2024 on August 30 2023
September 7, 2023

☀️Earnings Overview
On August 30 2023, FIVE BELOW ($NASDAQ:FIVE) reported their Q2 earnings for fiscal year 2024, which showed total revenue of USD 759.0 million for the period ending July 31 2023 – representing an increase of 13.5% from the same quarter a year prior. Net income also saw a 13.3% year-over-year increase to USD 46.8 million.
Price History
On Wednesday, August 30 2023, FIVE BELOW reported strong financial results for the second quarter of FY2024. The company’s stock opened at $181.5 and closed at $183.0, representing a 0.1% increase from its previous closing price of 182.7. Overall, FIVE BELOW’s Q2 results exceeded analysts’ expectations. This represents a strong performance compared to the same period last year. In terms of product categories, FIVE BELOW saw growth across its five main product categories: Apparel, Accessories & Footwear, Electronics & Accessories, Home & Party, Toys & Sporting Goods, and Room Decor & Storage.
The company reported double-digit percentage growth in all five categories on a year-over-year basis. Looking forward, FIVE BELOW is confident that its Q2 results are indicative of the company’s long-term potential for success. The company believes that its strong financial performance is a testament to its commitment to delivering value to customers at an affordable price point. Overall, FIVE BELOW reported strong Q2 earnings for FY2024 and is optimistic about the future prospects of the company. Live Quote…
About the Company
Income Snapshot
Below shows the total revenue, net income and net margin for Five Below. More…
| Total Revenues | Net Income | Net Margin |
| 3.25k | 271.78 | 8.4% |
Cash Flow Snapshot
Below shows the cash from operations, investing and financing for Five Below. More…
| Operations | Investing | Financing |
| 438.04 | -243.16 | -15.43 |
Balance Sheet Snapshot
Below shows the total assets, liabilities and book value per share for Five Below. More…
| Total Assets | Total Liabilities | Book Value Per Share |
| 3.55k | 2.11k | 25.87 |
Key Ratios Snapshot
Some of the financial key ratios for Five Below are shown below. More…
| 3Y Rev Growth | 3Y Operating Profit Growth | Operating Margin |
| 24.4% | 43.5% | 10.7% |
| FCF Margin | ROE | ROA |
| 5.5% | 15.4% | 6.1% |
Analysis
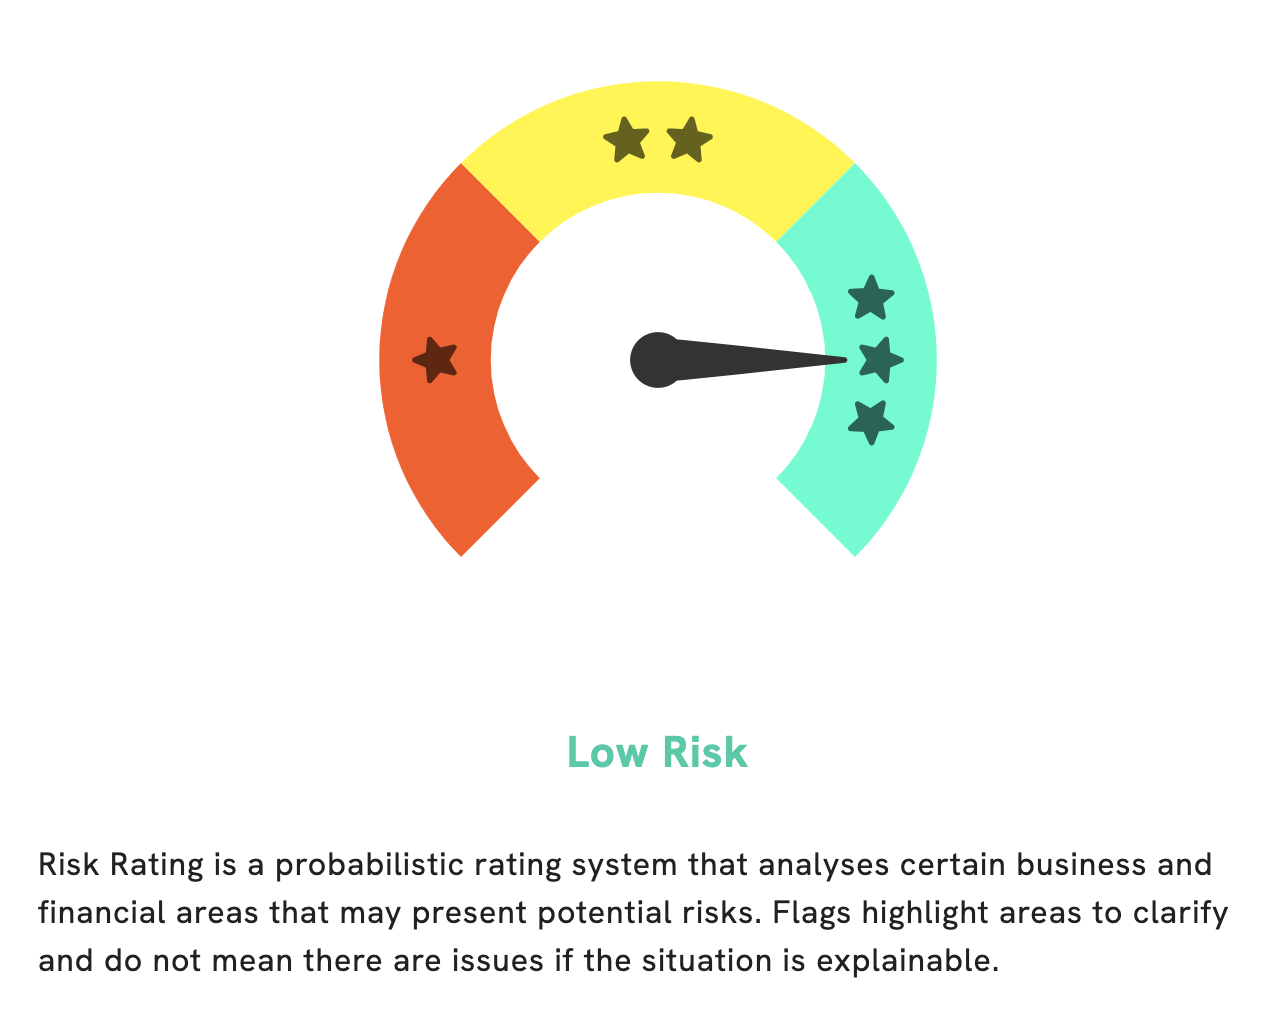
At GoodWhale, we’ve taken a deep dive into the fundamentals of FIVE BELOW, and we’d like to share our findings with you. Our Risk Rating indicates that this is a relatively low risk investment in terms of financial and business aspects. Overall, FIVE BELOW’s balance sheet looks healthy. However, we have detected one risk warning that we think you should know about. If you sign up with GoodWhale, we can provide you with more detailed results and insights. We’ll also make sure that you receive any future updates about FIVE BELOW’s financial health. More…
Peers
Despite the intense competition, Five Below Inc continues to thrive and has managed to carve out a niche for itself in the market.
– Ross Stores Inc ($NASDAQ:ROST)
Ross Stores Inc is a chain of American off-price department stores. It operates under two brands, Ross and dd’s DISCOUNTS. As of 2022, the company had a market cap of 40.44B, making it one of the largest retailers in the United States. In addition, Ross Stores Inc also has a strong Return on Equity (ROE) of 29.12%, which indicates that the company is making effective use of its shareholders’ funds. The company’s success is attributed to its effective management strategies and cost containment practices. The company has been able to maintain its market share and profitability despite the presence of competitors.
– O’Reilly Automotive Inc ($NASDAQ:ORLY)
O’Reilly Automotive Inc is an American retail company specializing in the distribution of automotive aftermarket parts, tools, supplies, equipment and accessories. As of 2022, O’Reilly Automotive Inc has a market capitalization of 50.97 billion US dollars, making it one of the largest publicly traded auto parts retailers in the US. The company’s Return on Equity (ROE) stands at -159.26%, indicating that it is not generating enough returns for its shareholders. Despite this, the company continues to focus on expanding its operations in order to increase its market share and profitability.
– Kirkland’s Inc ($NASDAQ:KIRK)
Kirkland’s Inc is a specialty retailer of home décor, furniture, and gifts. It has a market cap of 46.43M as of 2022, which is relatively low compared to other companies in the home décor industry. Despite this, the company has still managed to maintain a negative Return on Equity (-43.0%) which indicates that the company has failed to generate a return on the investments of its shareholders. This could be due to their lack of resources, or because their current strategy may not be optimal for creating shareholder value.
Summary
Five Below’s second-quarter results for fiscal year 2024 demonstrated strong financial performance, with total revenue growth of 13.5% and net income growth of 13.3% compared to the same period last year. The company’s performance reflects a strong customer base and successful strategies to increase sales, such as expanding its product offerings and focusing on digital channels to reach new customers. Investors should take note of the company’s solid financial performance and potential growth, as they consider investing in Five Below’s stock.
Related Posts


Recent Posts


