DUTCH BROS Reports Second Quarter Earnings for FY2023
August 18, 2023

🌥️Earnings Overview
On June 30th, 2023, DUTCH BROS ($NYSE:BROS) revealed their financial figures for the second quarter of FY2023. Overall revenue for the quarter increased by 34.1%, amounting to USD 249.9 million, compared to the previous year’s quarter. Net income for the quarter was USD 2.8 million, an impressive increase from the -0.9 million reported the year before.
Price History
The stock opened at $27.5 and closed at $28.0, representing a 0.3% increase from the prior closing price of 27.9. The company’s strong performance was attributed to increased customer loyalty and expanding its presence in new markets. DUTCH BROS also invested in digital initiatives, such as its new loyalty program, which has been a great success in driving customer engagement and increasing sales. Overall, the strong second quarter earnings demonstrated the company’s continued financial strength and its ability to capitalize on growth opportunities. With its focus on customer loyalty and digital initiatives, DUTCH BROS is well-positioned to continue to perform well in the future. Live Quote…
About the Company
Income Snapshot
Below shows the total revenue, net income and net margin for Dutch Bros. More…
| Total Revenues | Net Income | Net Margin |
| 847.62 | 0.01 | 0.0% |
Cash Flow Snapshot
Below shows the cash from operations, investing and financing for Dutch Bros. More…
| Operations | Investing | Financing |
| 89.01 | -206 | 119.41 |
Balance Sheet Snapshot
Below shows the total assets, liabilities and book value per share for Dutch Bros. More…
| Total Assets | Total Liabilities | Book Value Per Share |
| 1.37k | 1.1k | 2.33 |
Key Ratios Snapshot
Some of the financial key ratios for Dutch Bros are shown below. More…
| 3Y Rev Growth | 3Y Operating Profit Growth | Operating Margin |
| 45.8% | – | 4.1% |
| FCF Margin | ROE | ROA |
| -1.8% | 16.3% | 1.6% |
Analysis
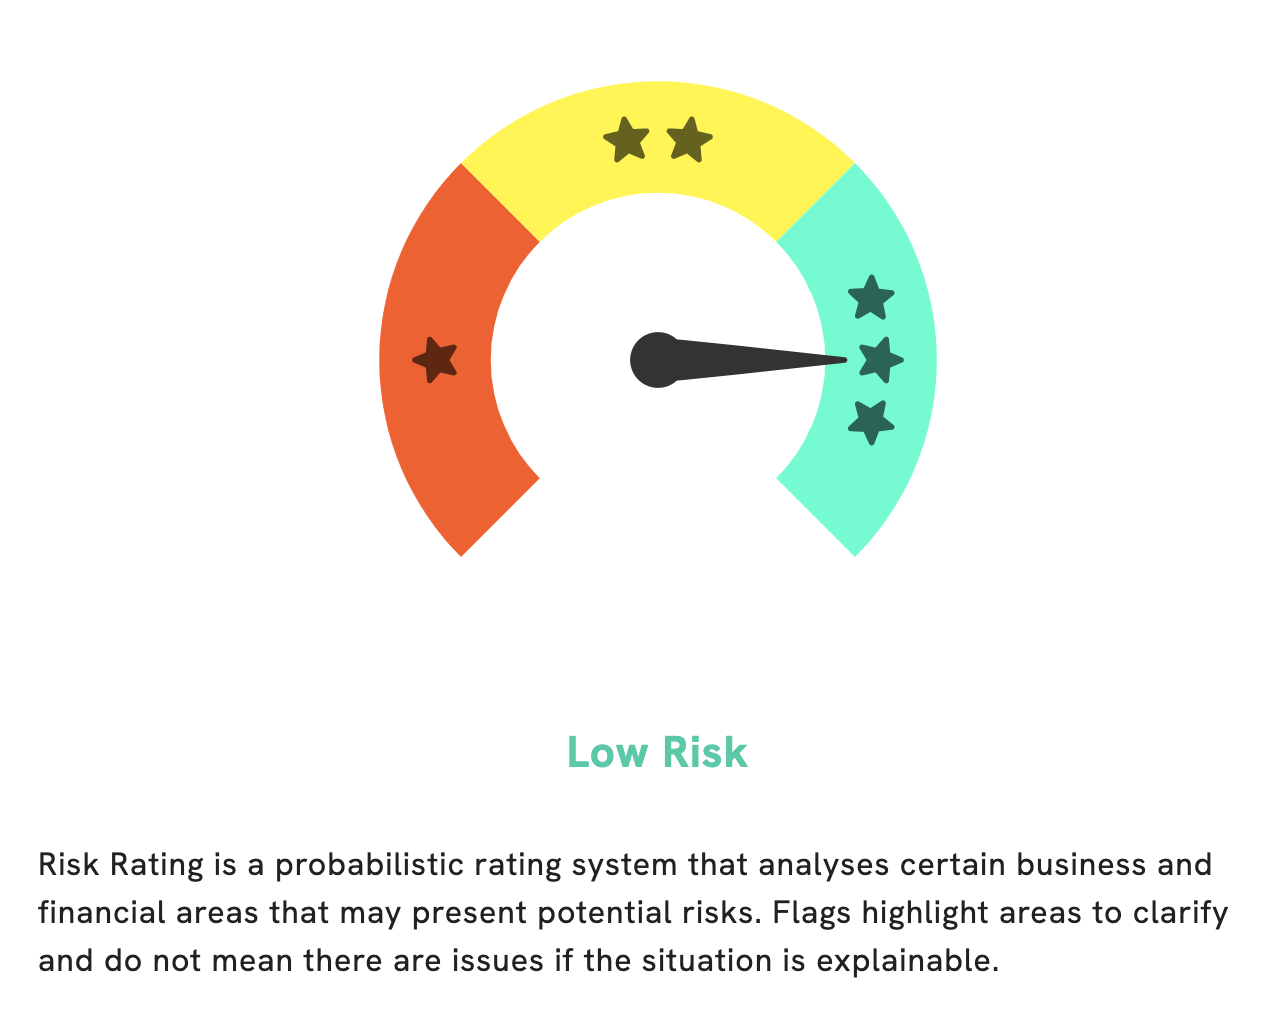
GoodWhale has conducted an in-depth analysis of DUTCH BROS’s financials, and our findings have enabled us to assign them a low risk rating. This is based on our assessment of the company’s financial and business aspects. We have identified two potential risk warnings within their balance sheet and cashflow statement that warrant further investigation. To gain insight into our findings, register as a GoodWhale user today and explore our detailed reports. We believe that this analysis has given a full picture of DUTCH BROS’s financial standing, making them a safe investment option for those seeking low-risk opportunities. More…
Peers
If you’re in the mood for a delicious milkshake, you may be wondering where to go. Two popular options are Dutch Bros Inc and Shake Shack Inc. Both companies offer a variety of flavors and toppings to choose from.
However, Shake Shack is often pricier than Dutch Bros. Another option is Williston Holding Co, which offers a wider range of food items, including milkshakes. Finally, Doutor Nichires Holdings Co Ltd is a popular choice in Japan for those looking for a delicious milkshake.
– Shake Shack Inc ($NYSE:SHAK)
Founded in 2004, Shake Shack is a modern day “roadside” burger stand serving a classic American menu of burgers, hot dogs, shakes, and more. The company has grown to operate over 200 locations across the globe, including in the United States, United Kingdom, Turkey, Russia, and more. Despite its impressive growth, Shake Shack’s market cap is a relatively modest 1.87 billion as of 2022. This is likely due to the company’s negative return on equity (-3.84%) which indicates that it is not generating enough profit to cover the cost of its equity.
– Williston Holding Co ($OTCPK:WHCA)
Williston Holding Co is a publicly traded company with a market capitalization of 401.76k as of 2022. The company has a return on equity of 7.94%. Williston Holding Co is engaged in the business of oil and gas exploration, production, and development in the Williston Basin in the United States.
– Doutor Nichires Holdings Co Ltd ($TSE:3087)
Doutor Nichires Holdings Co Ltd is a Japanese company that operates in the food and beverage industry. The company has a market capitalization of 72.96 billion as of 2022 and a return on equity of 2.52%. The company’s main operations consist of the production and sale of coffee, tea, and other beverages. The company also operates a chain of coffee shops called Doutor Coffee.
Summary
Investors looking to add DUTCH BROS to their portfolio have good reason to do so. In its second quarter of FY2023, the company reported impressive 34.1% revenue growth and a notable improvement in net income from -0.9 million to 2.8 million. This highlights the company’s ability to efficiently manage its resources and capitalise on opportunities. With solid financials and a strong outlook for the future, DUTCH BROS is a smart investment choice.
Related Posts


Recent Posts


