DOUGLAS ELLIMAN Reports Stellar Second Quarter Earnings Results for FY2023
August 11, 2023

🌥️Earnings Overview
On June 30, 2023, DOUGLAS ELLIMAN ($NYSE:DOUG) announced their second quarter of FY2023 financial results, revealing a 24.3% decrease in total revenue to USD 275.9 million compared to the same quarter in the previous year. The company reported a net income of -5.2 million, which was a decrease from 10.2 million in the same period of the prior year.
Price History
On Tuesday, DOUGLAS ELLIMAN reported stellar second quarter earnings results for FY2023, with their stock opening at $2.3 and closing at the same price at the end of the day. This rise of 8.4% from their last closing price of 2.1 was a strong indication of the company’s financial health and growth potential. The results demonstrate DOUGLAS ELLIMAN’s resilience during turbulent economic times, and show that they are well on their way to achieving their long-term goals. Investors have responded positively to the news, with the stock continuing to rise in the past few days. Live Quote…
About the Company
Income Snapshot
Below shows the total revenue, net income and net margin for Douglas Elliman. More…
| Total Revenues | Net Income | Net Margin |
| 969.81 | -44.51 | -4.7% |
Cash Flow Snapshot
Below shows the cash from operations, investing and financing for Douglas Elliman. More…
| Operations | Investing | Financing |
| -39.54 | -12.74 | -30 |
Balance Sheet Snapshot
Below shows the total assets, liabilities and book value per share for Douglas Elliman. More…
| Total Assets | Total Liabilities | Book Value Per Share |
| 518.13 | 268.7 | 2.8 |
Key Ratios Snapshot
Some of the financial key ratios for Douglas Elliman are shown below. More…
| 3Y Rev Growth | 3Y Operating Profit Growth | Operating Margin |
| 13.7% | 308.4% | -5.9% |
| FCF Margin | ROE | ROA |
| -5.2% | -14.4% | -6.9% |
Analysis
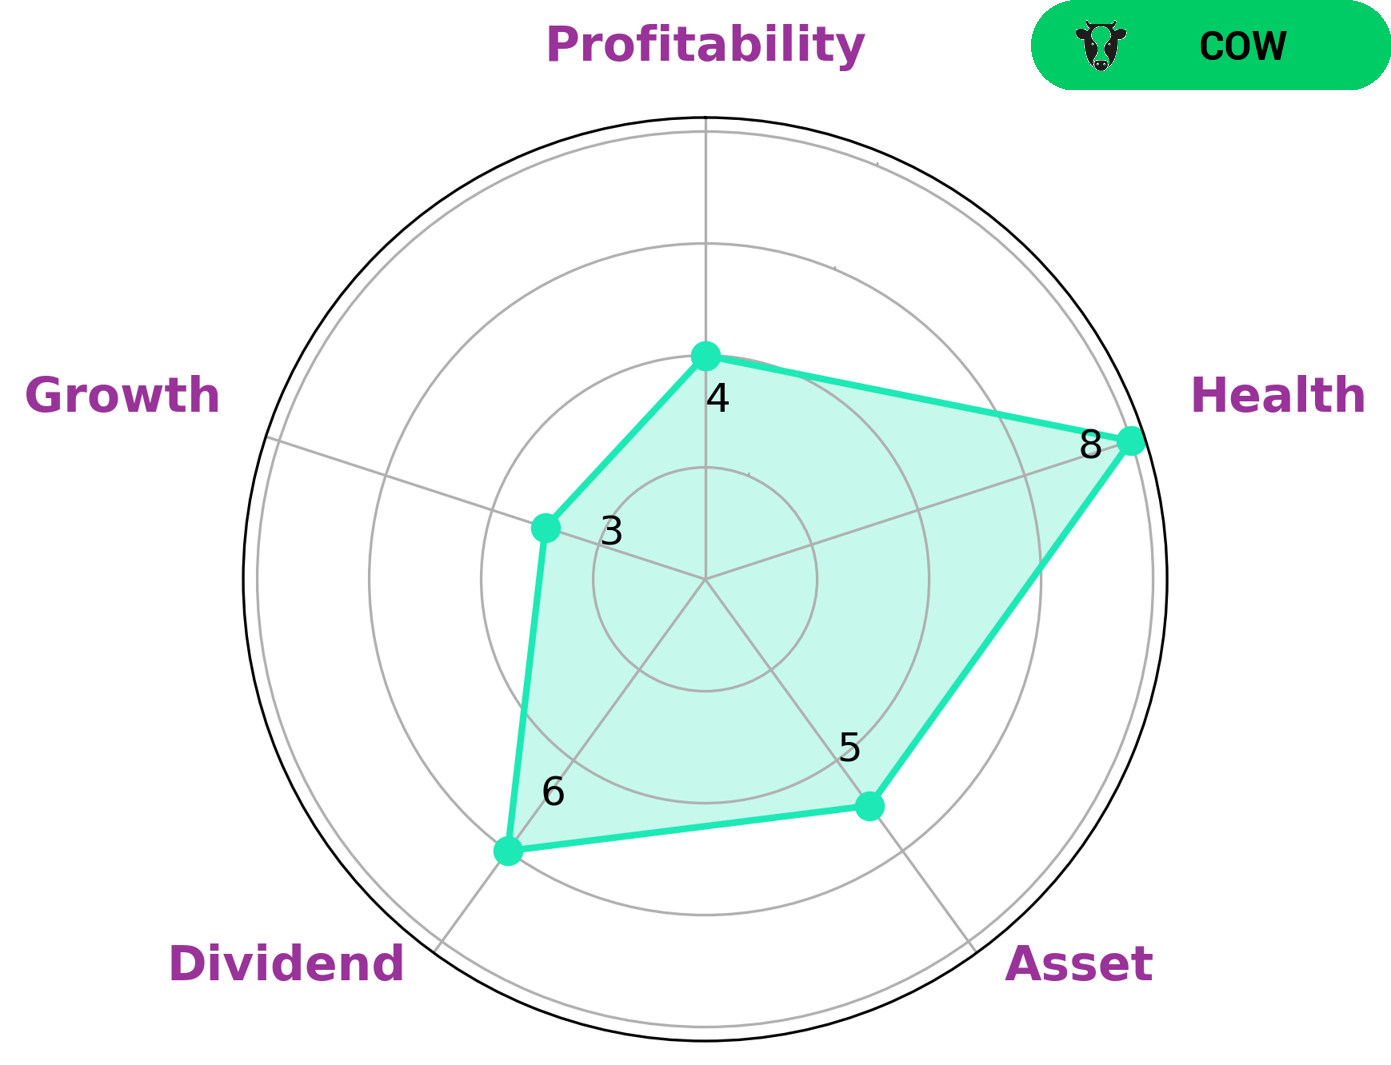
GoodWhale has performed an analysis of DOUGLAS ELLIMAN‘s financials and the results show a high health score of 8/10 with regard to its cashflows and debt. This indicates that DOUGLAS ELLIMAN is capable to safely ride out any crisis without the risk of bankruptcy. According to our Star Chart, DOUGLAS ELLIMAN is strong in asset, medium in dividend, profitability and weak in growth. We have classified DOUGLAS ELLIMAN as a ‘cow’, which indicates that it has the track record of paying out consistent and sustainable dividends. Therefore, we believe that DOUGLAS ELLIMAN is an attractive investment option for investors seeking long-term investments with stable returns. Investors who are looking for reliable income streams and steady dividends may be particularly interested in this company. More…
Peers
The four companies are all real estate service providers. APAC Realty Ltd is a Singapore-based real estate agency. Open House Group Co Ltd is a Hong Kong-based real estate agency. E-House (China) Enterprise Holdings Ltd is a real estate services company based in China.
– APAC Realty Ltd ($SGX:CLN)
The company’s market cap is 198.91M as of 2022 and its ROE is 16.64%. The company is involved in the business of real estate brokerage and development. It is one of the leading real estate companies in Singapore and has a strong presence in the region. The company has a diversified portfolio of properties and is well-positioned to capitalise on opportunities in the market.
– Open House Group Co Ltd ($TSE:3288)
Open House Group Co Ltd, a real estate company, engages in the development, sale, management, and operation of residential and commercial properties in Mainland China, Hong Kong, Macau, and Singapore. The company has a market cap of 645.8B as of 2022 and a Return on Equity of 22.55%. The company operates through the following segments: Property Development, Property Investment, Hotel Operations, and Property Management. The Property Development segment develops residential and commercial properties for sale. The Property Investment segment invests in properties for long-term income generation. The Hotel Operations segment manages and operates hotels. The Property Management segment provides property management services.
Summary
Douglas Elliman reported their second quarter of FY2023 earnings on June 30, 2023, with total revenue of USD 275.9 million, a 24.3% decrease from the previous year. The company reported a net loss of -5.2 million compared to a positive net income of 10.2 million in the prior year. Despite the decline in revenue and profit, the stock price rose the same day, suggesting a strong investor outlook for the company. Douglas Elliman has taken measures to reduce costs and improve efficiency to increase its appeal to investors, and the company remains a viable investment opportunity despite its current financial performance.
Related Posts


Recent Posts


