COSTAR GROUP Reports Q2 2023 Earnings Results on July 25
July 27, 2023

🌥️Earnings Overview
On July 25 2023, COSTAR GROUP ($NASDAQ:CSGP) released their earnings results for the second quarter of FY2023, which ended on June 30 2023. The total revenue for this quarter was USD 605.9 million, representing an increase of 13.0% year-on-year, and the reported net income was up 20.4%, at USD 100.5 million.
Stock Price
On Tuesday, July 25th 2023, COSTAR GROUP released its second quarter earnings results for 2023. The COSTAR GROUP stock opened at $90.2 and closed at $91.8, up 1.3% from the previous closing price of $90.6. The second quarter saw an increase in revenue and profitability for the company with strong performance in its core markets.
The strong performance of COSTAR GROUP in the second quarter reflects its efforts to expand its reach and improve its services in key markets, resulting in strong financials and increased customer satisfaction. This positive trend is expected to continue in the coming quarters as the company continues to focus on developing new services and expanding into new markets. Live Quote…
About the Company
Income Snapshot
Below shows the total revenue, net income and net margin for Costar Group. More…
| Total Revenues | Net Income | Net Margin |
| 2.32k | 384.31 | 16.6% |
Cash Flow Snapshot
Below shows the cash from operations, investing and financing for Costar Group. More…
| Operations | Investing | Financing |
| 564.9 | -65.77 | 742.28 |
Balance Sheet Snapshot
Below shows the total assets, liabilities and book value per share for Costar Group. More…
| Total Assets | Total Liabilities | Book Value Per Share |
| 8.69k | 1.59k | 17.05 |
Key Ratios Snapshot
Some of the financial key ratios for Costar Group are shown below. More…
| 3Y Rev Growth | 3Y Operating Profit Growth | Operating Margin |
| 15.2% | 1.1% | 15.6% |
| FCF Margin | ROE | ROA |
| 22.8% | 3.2% | 2.6% |
Analysis
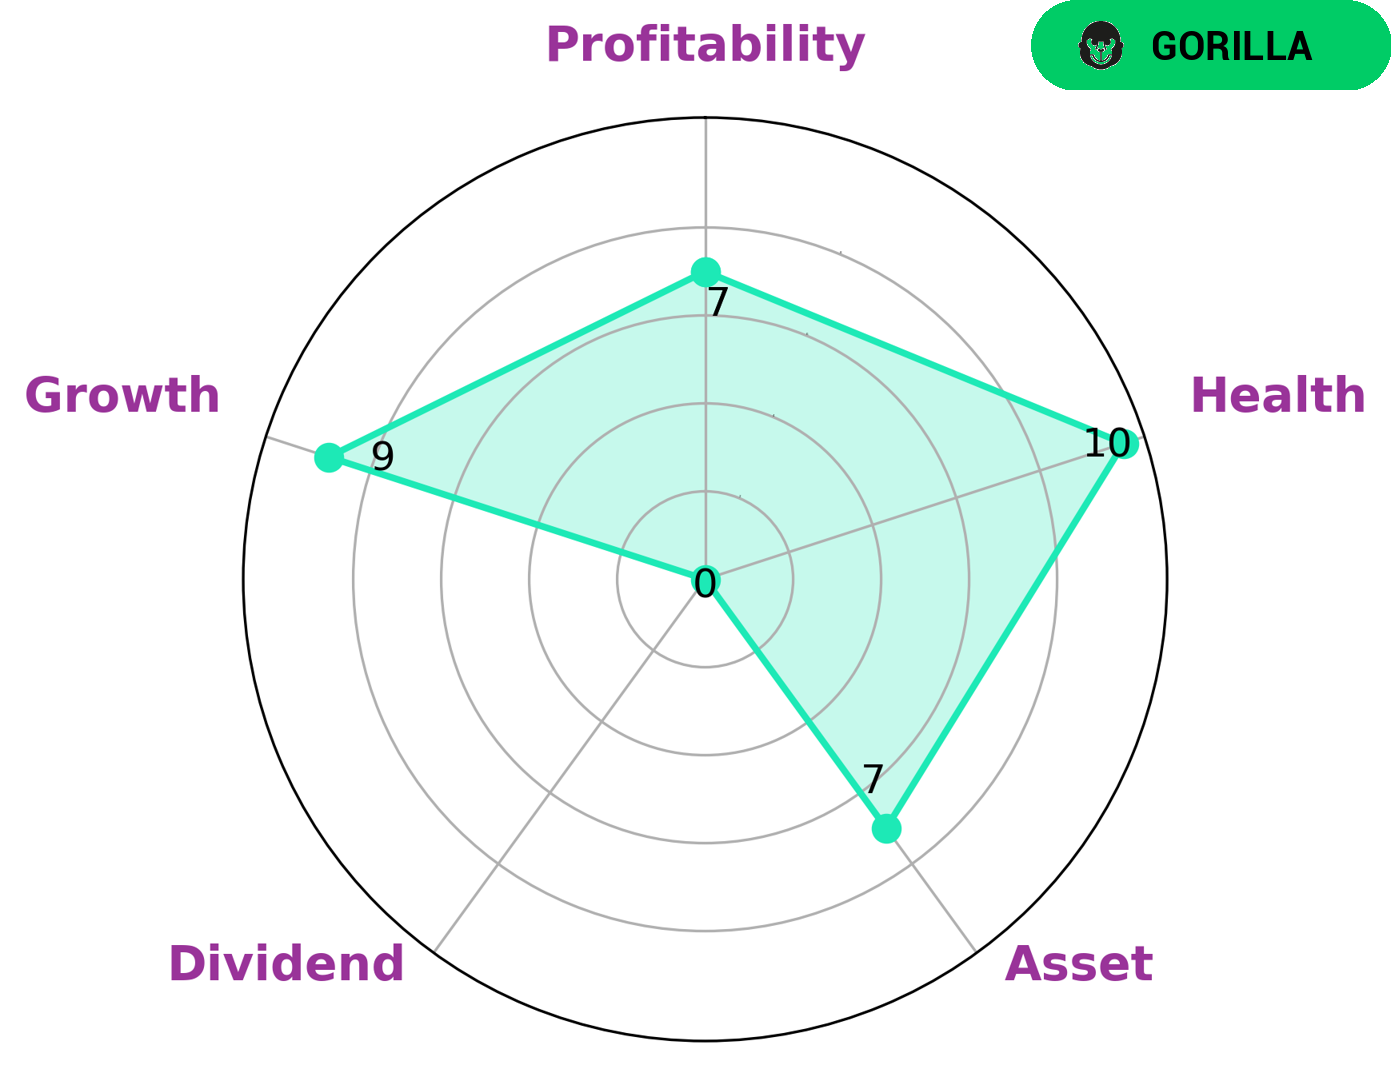
As part of GoodWhale’s analysis of COSTAR GROUP‘s fundamentals, we examined the Star Chart, which shows that COSTAR GROUP is strong in asset, growth, profitability, and weak in dividend. Based on this information, we have classified COSTAR GROUP as a ‘gorilla’, a type of company that has achieved stable and high revenue or earning growth due to its strong competitive advantage. For investors interested in COSTAR GROUP, this is an attractive opportunity. COSTAR GROUP has a high health score of 10/10 considering its cashflows and debt, which suggests that it is capable to safely ride out any crisis without the risk of bankruptcy. Furthermore, the strong growth and profitability indicate that the company can generate healthy returns for its investors. More…
Peers
CoStar Group Inc is a commercial real estate information and analytics company. Its competitors are Altus Group Ltd, Aroundtown SA, and Belpointe PREP LLC.
– Altus Group Ltd ($TSX:AIF)
Altus Group is a leading provider of independent advisory services, software and data solutions to the global commercial real estate industry. Our integrity, innovative technology and comprehensive data and analytics enable us to help our clients make informed decisions and drive business value. We have a deep understanding of the forces shaping the commercial real estate industry and a proven track record of helping our clients achieve their business objectives.
– Aroundtown SA ($LTS:0RUH)
The company’s market capitalization is $2.75 billion and its return on equity is 7.46%. The company is a real estate investment trust that owns, operates, and develops properties in Germany.
– Belpointe PREP LLC ($NYSEAM:OZ)
As of 2022, Belpointe PREP LLC has a market cap of 302.88M and a Return on Equity of -1.62%. The company is a provider of educational services. It offers a variety of services to its students, including academic advising, tutoring, and college counseling. Belpointe PREP LLC is committed to providing its students with the skills and knowledge necessary to succeed in their academic pursuits.
Summary
COSTAR GROUP posted impressive results for their second quarter of FY2023, boasting a 13.0% year-on-year rise in total revenue, reaching USD 605.9 million. Net income also saw an impressive jump of 20.4%, amounting to USD 100.5 million. This strong performance can be attributed to the company’s strategic investments and cost-cutting initiatives, proving that COSTAR GROUP is an investment worth considering. The company’s future outlook looks promising provided their continued ability to identify potential opportunities and capitalize on them in a timely manner.
Related Posts


Recent Posts


