Celebrating the Legacy of St. Joe
March 2, 2023

Earnings report
The legacy of St. Joe ($NYSE:JOE) continues to be celebrated on February 22, 2023, when the company reported its fourth quarter earnings results for Fiscal Year 2022. Total revenue for the quarter amounted to USD 28.1 million, which represented a decrease of 11.9% compared to the same period in the prior year. This decrease was partially offset by a notable increase in net income for the quarter, which amounted to USD 61.6 million, a decrease of 38.1% from the same period in the prior year. The commitment, dedication, and innovative drive put forth by the team at St. Joe is one worth recognizing and saluting, as they remain dedicated to providing top-notch service, products, and customer satisfaction.
Stock Price
JOE. After the market opened at $44.4, ST. JOE‘s stock closed at $44.6, representing a 0.7% increase from its previous closing price of $44.3. This jump in price serves as a reminder of the positive impact that ST.
JOE has had on the market and economy. The company has been a driving force behind innovation, growth and diversification within their sector, and Wednesday’s performance served to reinforce this impact. Live Quote…
About the Company
Income Snapshot
Below shows the total revenue, net income and net margin for St. Joe. More…
| Total Revenues | Net Income | Net Margin |
| 252.32 | 70.93 | 24.7% |
Cash Flow Snapshot
Below shows the cash from operations, investing and financing for St. Joe. More…
| Operations | Investing | Financing |
| 48.22 | -189.78 | 112.46 |
Balance Sheet Snapshot
Below shows the total assets, liabilities and book value per share for St. Joe. More…
| Total Assets | Total Liabilities | Book Value Per Share |
| 1.43k | 779.73 | 10.81 |
Key Ratios Snapshot
Some of the financial key ratios for St. Joe are shown below. More…
| 3Y Rev Growth | 3Y Operating Profit Growth | Operating Margin |
| 25.7% | 25.2% | 44.8% |
| FCF Margin | ROE | ROA |
| -83.6% | 11.3% | 4.9% |
Analysis
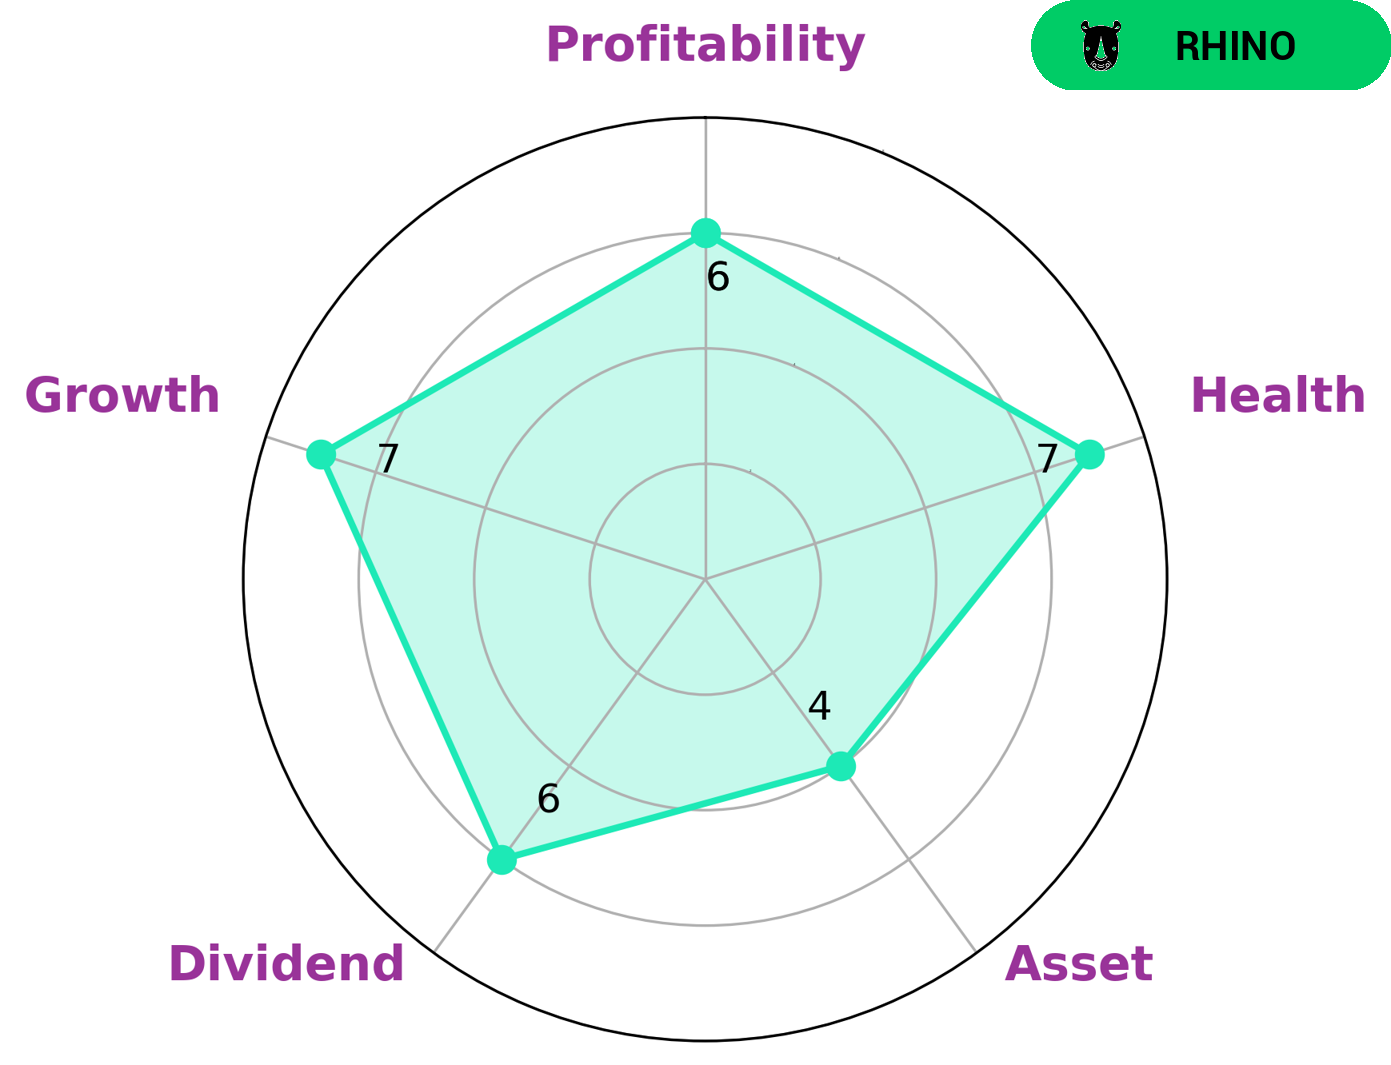
After conducting a financial analysis of ST. JOE, GoodWhale’s Star Chart gave the company a health score of 7 out of 10, indicating that they are well-positioned to sustain future operations even in times of economic stress. ST. JOE is classified as a ‘rhino’: a company that has achieved moderate revenue or earnings growth. Overall, ST. JOE is strong in growth and medium in asset, dividend and profitability, which could make it an attractive investment opportunity for many types of investors. Growth-oriented investors may be interested in ST. JOE for its potential for medium to long-term increases in revenue and earnings. Value investors may be attracted by ST. JOE’s lower debt load, as well as its conservative approach to dividend and profitability. Income investors may be looking for ST. JOE’s potential for regular dividend payments. More…
Peers
As of February 2021, it ranked #426 on the Fortune 500 list of the largest United States corporations by total revenue. The company’s main competitors are Rockwell Land Corp, Bresler & Reiner Inc, and Cebu Landmasters Inc.
– Rockwell Land Corp ($PSE:ROCK)
Rockwell Land Corp is a real estate company that develops, manages, and markets properties in the Philippines. As of 2022, the company had a market capitalization of 7.95 billion US dollars and a return on equity of 10.07%. The company was founded in 1976 and is headquartered in Makati, Philippines. Rockwell Land Corp is one of the largest real estate developers in the Philippines and is known for developing luxury residential and commercial properties.
– Bresler & Reiner Inc ($OTCPK:BRER)
Bresler & Reiner Inc is a company that provides services to the oil and gas industry. It has a market cap of 3.83 million as of 2022 and a return on equity of -3.56%. The company has been in business for over 50 years and has a strong reputation in the industry. It is headquartered in Houston, Texas.
– Cebu Landmasters Inc ($PSE:CLI)
Cebu Landmasters Inc is a publicly-listed company in the Philippines with a market capitalization of PHP 9.25 billion as of March 31, 2022. The company is engaged in the business of real estate development, marketing, and selling of horizontal and vertical residential, office, retail, and industrial projects. As of December 31, 2020, Cebu Landmasters Inc had total assets of PHP 50.6 billion and total equity of PHP 30.4 billion. The company’s ROE for 2020 was 22.0%.
Summary
ST. JOE reported a total revenue of USD 28.1M for the quarter, an 11.9% decrease compared to the prior year. This was offset by a decrease in net income of 38.1% to USD 61.6M, indicating that the company’s profitability dropped significantly despite its revenue decline.
Investing in ST. JOE is risky as its revenue and income have both decreased, so investors should watch the company’s performance in the coming quarters before making any decisions.
Related Posts


Recent Posts


