CASEY’S GENERAL STORES Reports Record First Quarter Earnings for FY2024
September 14, 2023

🌥️Earnings Overview
On the 11th of September 2023, CASEY’S GENERAL STORES ($NASDAQ:CASY) announced the earnings results for the first quarter of FY2024, which ended on July 31 2023. Their total revenue for the quarter was USD 3869.2 million, a drop of 13.1% compared to the same period last year. Net income, though, increased 10.7% from the previous year and amounted to USD 169.2 million.
Price History
The company’s stock opened at $241.9 and closed at $239.4, down by 1.0% from the previous closing price of 241.9. CEO Robert J. Myers credited the strong performance to the company’s focus on increasing sales and operating efficiencies. The company’s strong performance was also due to improved customer service initiatives. CASEY’S GENERAL STORES invested in new technology and training programs to better serve their customers.
These efforts have paid off, as customer satisfaction ratings have improved and sales have continued to grow. CASEY’S GENERAL STORES’ stock performance has been volatile in recent months, but the company’s strong first quarter results show that it is well-positioned for future growth. Live Quote…
About the Company
Income Snapshot
Below shows the total revenue, net income and net margin for CASY. More…
| Total Revenues | Net Income | Net Margin |
| 14.51k | 463 | 3.2% |
Cash Flow Snapshot
Below shows the cash from operations, investing and financing for CASY. More…
| Operations | Investing | Financing |
| 834.88 | -543.33 | -164.79 |
Balance Sheet Snapshot
Below shows the total assets, liabilities and book value per share for CASY. More…
| Total Assets | Total Liabilities | Book Value Per Share |
| 6.06k | 3.29k | 74.5 |
Key Ratios Snapshot
Some of the financial key ratios for CASY are shown below. More…
| 3Y Rev Growth | 3Y Operating Profit Growth | Operating Margin |
| 18.8% | 14.2% | 4.5% |
| FCF Margin | ROE | ROA |
| 2.6% | 15.1% | 6.8% |
Analysis
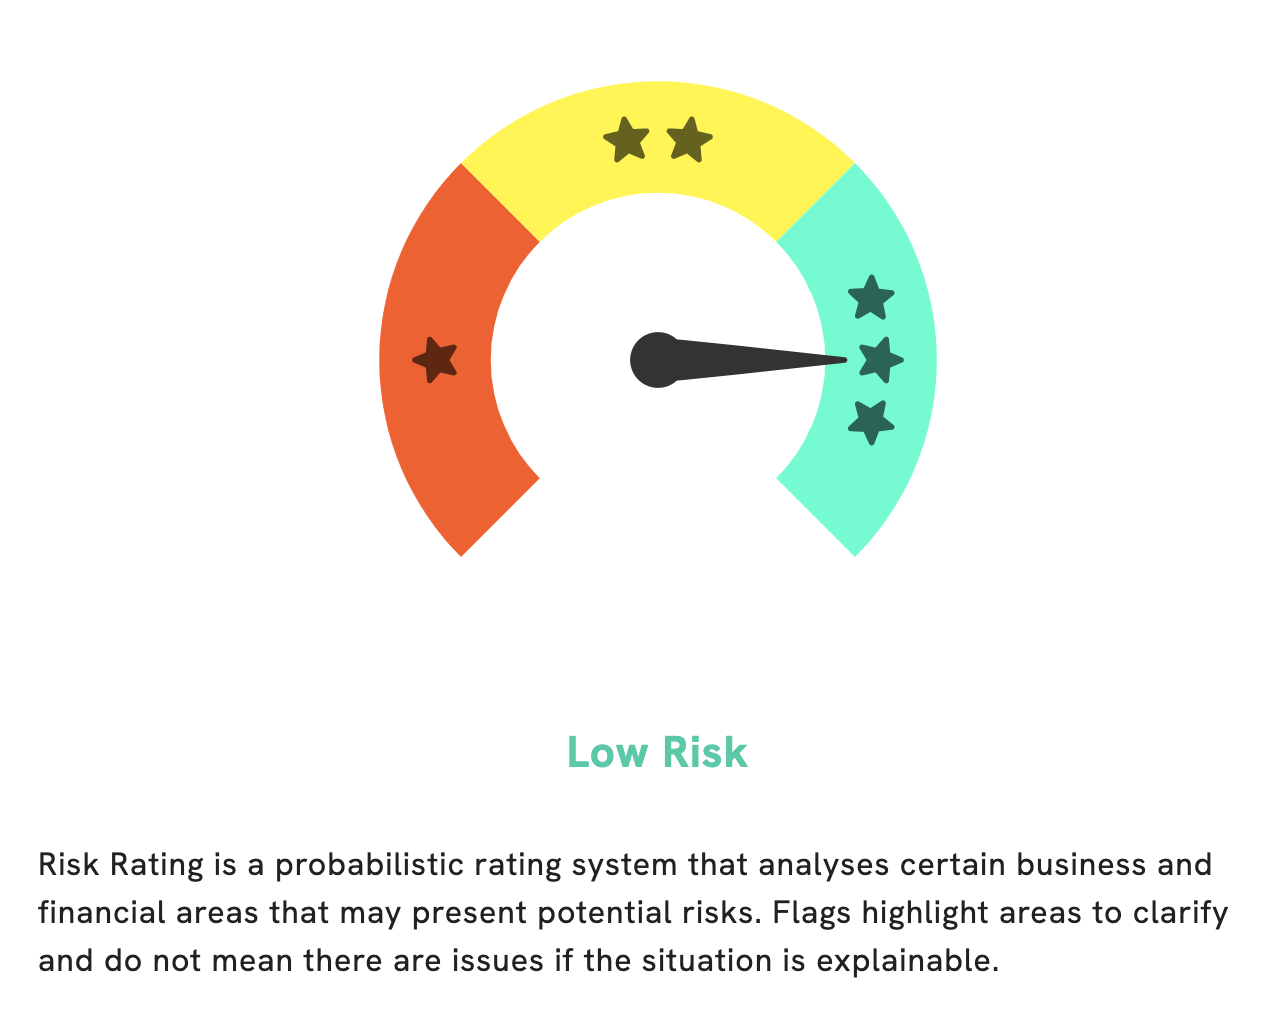
At GoodWhale, we examined the financials of CASEY’S GENERAL STORES in order to determine its risk rating. Our analysis concluded that this company is a low-risk investment, taking both the financial and business aspects into account. We detected two risk warnings in the income sheet and balance sheet of CASEY’S GENERAL STORES. If you would like to review these risks, please register on GoodWhale.com and we will be happy to provide you with the information. More…
Peers
Casey’s General Stores Inc is in competition with Murphy USA Inc, Nanning Department Store Co Ltd, Hunan Friendship & Apollo Commercial Co Ltd. All four of these companies are retailers that offer similar products and services. The competition between these companies is based on price, quality, convenience, and customer service.
– Murphy USA Inc ($NYSE:MUSA)
Murphy USA Inc is a gas station and convenience store chain that operates in the southern and midwestern United States. As of 2022, the company has a market cap of 6.47B and a return on equity of 64.41%. The company was founded in 1996 and is headquartered in El Dorado, Arkansas. Murphy USA operates over 1,400 gas stations and convenience stores across the United States. The company’s gas stations offer a variety of fuels, including regular, premium, and diesel. In addition to gasoline, Murphy USA convenience stores sell a variety of food and beverage items, such as snacks, candy, soft drinks, and coffee.
– Nanning Department Store Co Ltd ($SHSE:600712)
Nanning Department Store Co Ltd has a market cap of $2.04 billion as of 2022 and a Return on Equity of 0.63%. The company operates department stores in Nanning, Guangxi, China. It offers a range of merchandise, including apparel, cosmetics, and home appliances. The company also operates a loyalty program that offers discounts and rewards to customers who shop at its stores.
– Hunan Friendship & Apollo Commercial Co Ltd ($SZSE:002277)
Hunan Friendship & Apollo Commercial Co Ltd is a company that operates in the commercial sector. It has a market capitalization of 4.99 billion as of 2022 and a return on equity of 3.02%. The company focuses on providing commercial services to businesses in China. These services include leasing, property management, and investment management. The company also provides consulting services for businesses expanding into China.
Summary
CASEY’S GENERAL STORES reported its first quarter FY2024 earnings on September 11 2023. Total revenue dropped 13.1% year over year to USD 3869.2 million, however net income rose 10.7% to USD 169.2 million. Investors should look closer at the results and consider the potential impacts of the decrease in revenue on future earnings and growth prospects of the company. Long-term investors should look at the company’s cash flow and dividend yields, as well as other factors such as profitability, debt levels, and management quality.
Additionally, investors should consider the industry outlook and any macroeconomic factors that may influence the stock price.
Related Posts


Recent Posts


