Bloomin’ Brands Intrinsic Value – BLOOMIN’ BRANDS Reports Second Quarter Earnings Results for FY 2023
August 9, 2023

🌥️Earnings Overview
For the second quarter of Fiscal Year 2023, BLOOMIN’ BRANDS ($NASDAQ:BLMN) reported total revenue of USD 1152.7 million, up 2.4% from the same period in the prior year. Additionally, the company reported a net income of USD 68.3 million, a dramatic increase when compared to the net income of -63.6 million for the same quarter in the previous year.
Share Price
On Tuesday, BLOOMIN’ BRANDS reported its second quarter earnings results for FY 2023. The company’s stock opened at $27.4 and closed at $26.0, down by 3.2% from its prior closing price of $26.9. The results showed a slight decline from its prior quarter performance, but the overall performance was still fairly positive. This result was driven by improved guest satisfaction levels and strong sales in the company’s outback steakhouse restaurants.
The company is optimistic about its future performance, citing the promising results of its recent strategic initiatives and new product launches. With the strong performance shown in this quarter’s earnings report, BLOOMIN’ BRANDS is well positioned to continue its success in the coming quarters. Live Quote…
About the Company
Income Snapshot
Below shows the total revenue, net income and net margin for Bloomin’ Brands. More…
| Total Revenues | Net Income | Net Margin |
| 4.55k | 249.62 | 5.7% |
Cash Flow Snapshot
Below shows the cash from operations, investing and financing for Bloomin’ Brands. More…
| Operations | Investing | Financing |
| 433.45 | -201.14 | -195.5 |
Balance Sheet Snapshot
Below shows the total assets, liabilities and book value per share for Bloomin’ Brands. More…
| Total Assets | Total Liabilities | Book Value Per Share |
| 3.27k | 2.9k | 3.67 |
Key Ratios Snapshot
Some of the financial key ratios for Bloomin’ Brands are shown below. More…
| 3Y Rev Growth | 3Y Operating Profit Growth | Operating Margin |
| 8.3% | 18.9% | 7.6% |
| FCF Margin | ROE | ROA |
| 4.2% | 67.5% | 6.6% |
Analysis – Bloomin’ Brands Intrinsic Value
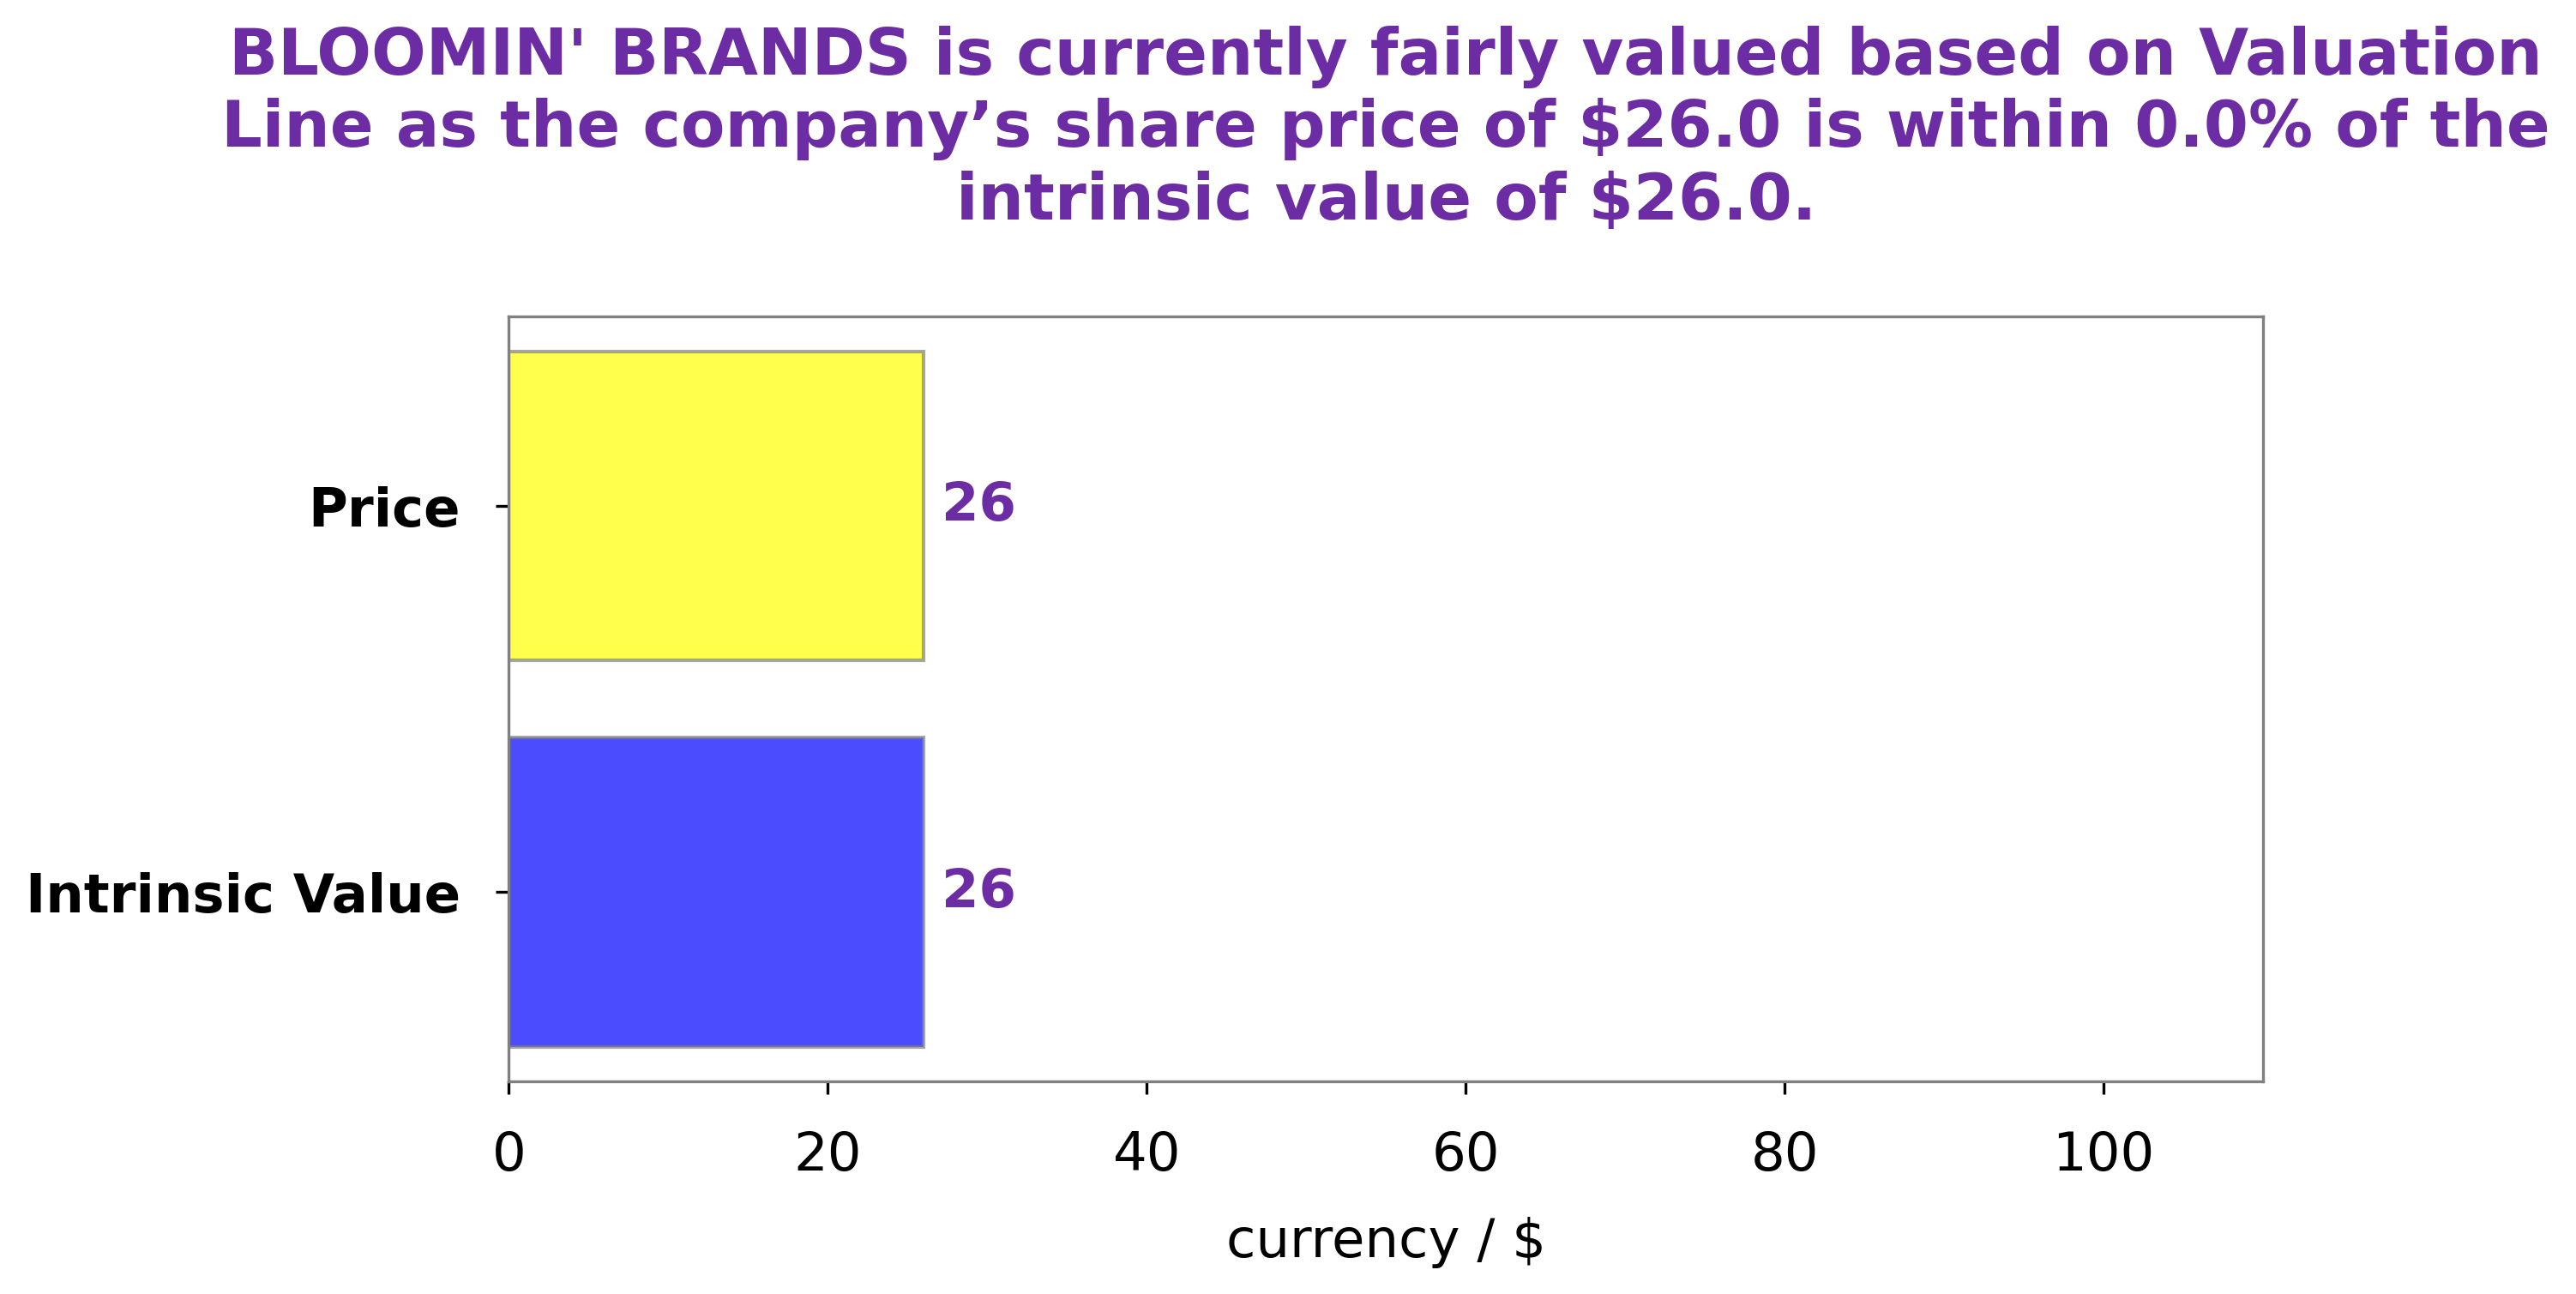
At GoodWhale, we have conducted an in-depth analysis of BLOOMIN’ BRANDS‘ wellbeing. Our proprietary Valuation Line has calculated the intrinsic value of BLOOMIN’ BRANDS stock to be around $26.0. This means that, right now, BLOOMIN’ BRANDS shares are trading at a fair price of $26.0. We believe that investors should take advantage of this fair price and purchase BLOOMIN’ BRANDS stock now for a sound investment. More…
Peers
Bloomin Brands Inc. is an international restaurant company that owns and operates several casual dining restaurant chains. Its competitors include Rave Restaurant Group Inc, Alsea SAB de CV, and BJ’s Restaurants Inc.
– Rave Restaurant Group Inc ($NASDAQ:RAVE)
Rave Restaurant Group Inc is a publicly traded company that owns and operates several restaurant brands, including Pizza Inn and Pie Five Pizza Co. As of 2022, the company had a market capitalization of $31 million and a return on equity of 14.79%. The company’s restaurants are located in the United States, Canada, and Puerto Rico.
– Alsea SAB de CV ($OTCPK:ALSSF)
Alsea SAB de CV is a Mexican food and beverage company with a market cap of 1.53B as of 2022. The company has a Return on Equity of 52.23%. Alsea SAB de CV operates in Mexico, Argentina, Chile, Colombia, and Brazil. The company operates through four segments: Mexico, South America, Central America, and Direct Operations. The company offers a variety of food and beverage products under the brands of Starbucks, Domino’s Pizza, Burger King, Havanna, Pizza Hut, and others.
– BJ’s Restaurants Inc ($NASDAQ:BJRI)
BJ’s Restaurants Inc is a leading operator of casual dining restaurants in the United States. The company operates over 190 restaurants in 26 states. BJ’s Restaurants Inc offers a variety of menu items, including pizzas, burgers, sandwiches, and salads. The company also offers a variety of alcoholic beverages. BJ’s Restaurants Inc has a market cap of 764.37M as of 2022, a Return on Equity of -3.52%. The company’s focus on quality food and beverages, friendly service, and value pricing has made it a popular destination for casual dining.
Summary
Investors responded to BLOOMIN’ BRANDS‘ second quarter of fiscal year 2023, which ended on June 30, 2023, with a decline in stock price. The company reported total revenue of USD 1152.7 million, a 2.4% increase from the same period last year. Additionally, net income rose to USD 68.3 million from the -63.6 million reported in the same quarter of the previous year. Overall, the company has shown strong performance and profitability, making it an attractive investment for those looking for growth potential.


