Bilibili Inc Intrinsic Value Calculation – BILIBILI INC Reports Q1 FY2023 Earnings Results, Ending June 2, 2023
June 10, 2023

🌥️Earnings Overview
For the first quarter of fiscal year 2023, ending June 2, 2023, BILIBILI INC ($NASDAQ:BILI) reported total revenue of CNY 5069.6 million, representing a 0.3% year-on-year increase. Net income was reported at CNY -627.7 million, a significant improvement from the -2282.0 million posted in the same quarter of FY2022.
Price History
On Friday, BILIBILI INC released their Q1 FY2023 earnings report, ending on June 2, 2023. The report revealed that overall, the company’s stock opened at $15.9 and closed at $15.3, a decrease of 3.5% from its last closing price of $15.9. This was a disappointing result for investors, especially as the company had achieved strong performance over the past few quarters. The company attributed this decrease in net income to increased investments in research and development, marketing and customer acquisition activities.
They also stated that they are continuing to invest heavily in technologies such as cloud computing and artificial intelligence to further enhance their platform capabilities and expand their user base. Overall, despite the disappointing numbers, BILIBILI INC maintained a positive outlook on the future of their business, and stated that they are confident in their ability to continue delivering value for shareholders in the long run. Live Quote…
About the Company
Income Snapshot
Below shows the total revenue, net income and net margin for Bilibili Inc. More…
| Total Revenues | Net Income | Net Margin |
| 21.91k | -5.84k | -31.2% |
Cash Flow Snapshot
Below shows the cash from operations, investing and financing for Bilibili Inc. More…
| Operations | Investing | Financing |
| -3.91k | 10.61k | -4.35k |
Balance Sheet Snapshot
Below shows the total assets, liabilities and book value per share for Bilibili Inc. More…
| Total Assets | Total Liabilities | Book Value Per Share |
| 40.98k | 23.39k | 43.47 |
Key Ratios Snapshot
Some of the financial key ratios for Bilibili Inc are shown below. More…
| 3Y Rev Growth | 3Y Operating Profit Growth | Operating Margin |
| 41.6% | – | -25.1% |
| FCF Margin | ROE | ROA |
| -30.3% | -20.9% | -8.4% |
Analysis – Bilibili Inc Intrinsic Value Calculation
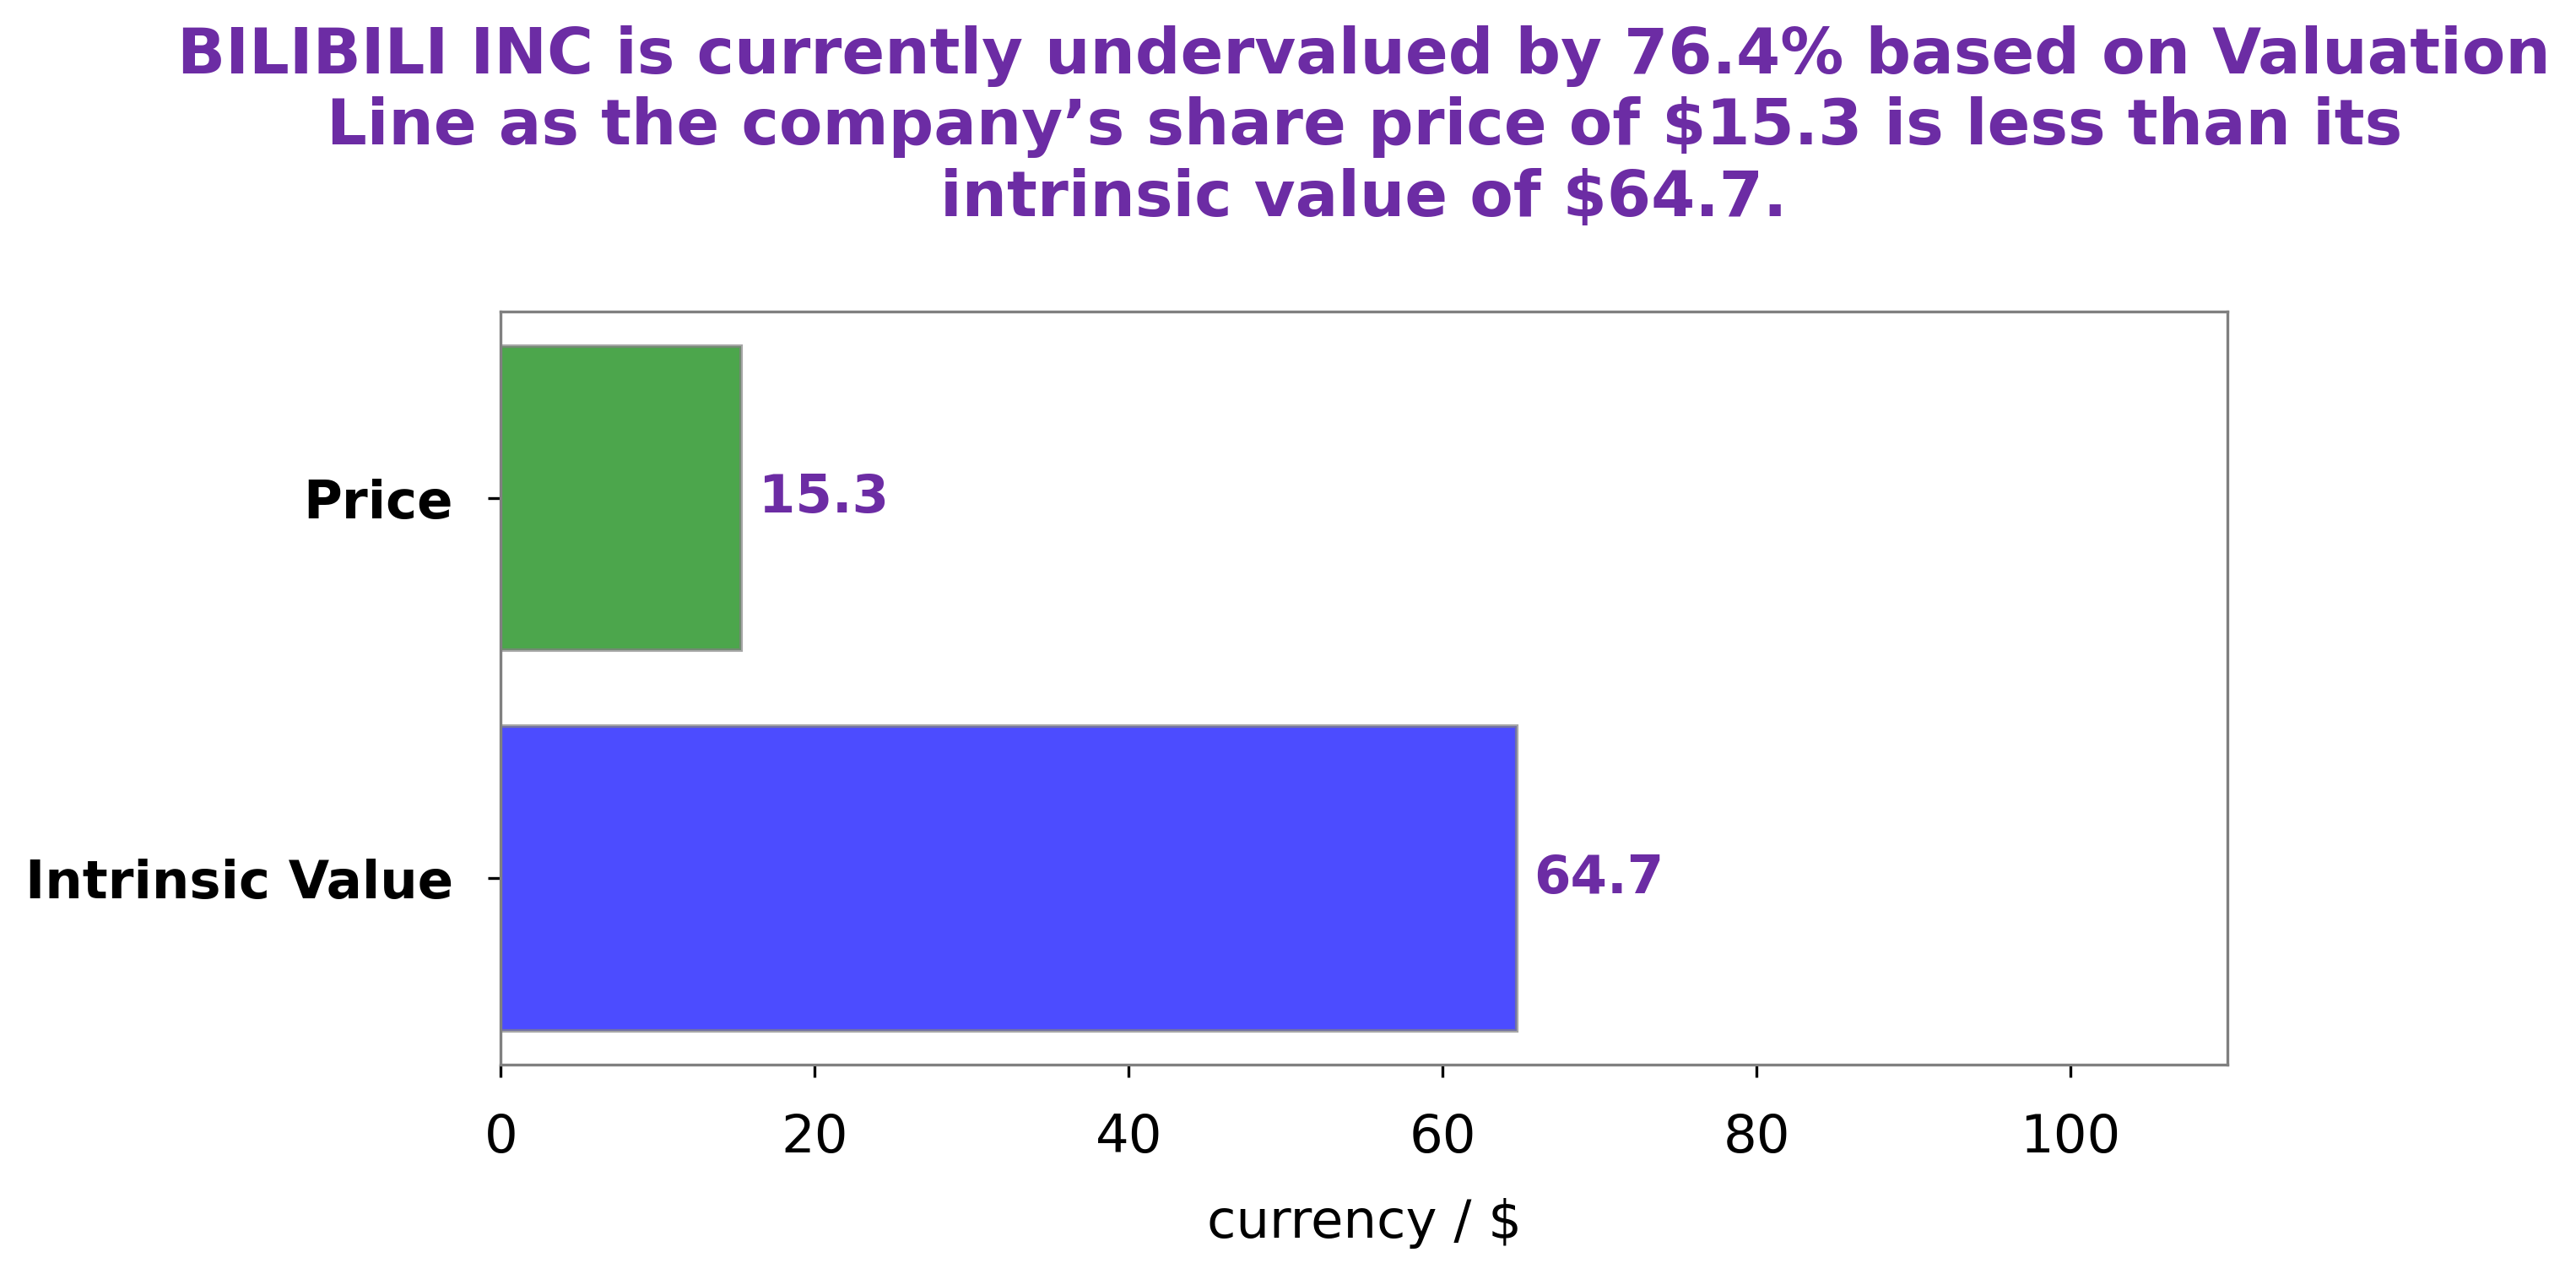
GoodWhale has conducted an analysis of the fundamentals of BILIBILI INC. Our proprietary Valuation Line has calculated the intrinsic value of BILIBILI INC share to be around $64.7. Comparatively, the current stock price of BILIBILI INC is at $15.3, representing a 76.4% discount to its intrinsic value. This undervaluation presents an attractive investment opportunity for investors. More…
Summary
Despite posting an increase in total revenue of 0.3% year-on-year, BILIBILI INC reported a net income of -627.7 million for the first quarter of its fiscal year 2023, compared to -2282.0 million from the same period in the previous year. This caused stock prices to drop the same day. Investors should consider the company’s long-term performance and growth prospects when considering investing in BILIBILI INC. They should also look at the company’s financial results over time, its competitive position, and any potential risks before committing to an investment.


