APPLIED MATERIALS Reports Earnings Results for FY2023 Q1, Ending January 31 2023.
February 21, 2023

Earnings Overview
On February 16 2023, Applied Materials ($NASDAQ:AMAT) released its financial results for the first quarter of its fiscal year 2023, which ended on January 31 2023. The company earned USD 1.7 billion in revenue, a decrease of 3.9% from the same period a year ago. Nevertheless, their net income rose 7.5% from the prior year to USD 6.7 billion.
Transcripts Simplified
Applied Materials Inc. reported Q1 net sales of nearly $6.74 billion and non-GAAP EPS of $2.03. Non-GAAP gross margin increased 80 basis points sequentially to 46.8%. Semi Systems revenue grew by 13% year-over-year to $5.16 billion, and AGS revenue grew nearly 4% year-over-year to approximately $1.37 billion. Operating cash flow during the quarter was $2.27 billion, and $470 million was returned to shareholders. Applied Materials expects Q2 revenue to be nearly $6.4 billion, plus or minus $400 million, or up over 2% year-over-year.
Non-GAAP EPS is expected to be $1.84 plus or minus $0.18. Semi Systems revenue is expected to be about $4.84 billion, up over 8% year-over-year, and AGS revenue is expected to be around $1.34 billion, down around 3% year-over-year. Non-GAAP gross margin should be around 46.5%, and non-GAAP operating expenses should be around $1.16 billion.
About the Company
Income Snapshot
Below shows the total revenue, net income and net margin for Applied Materials. More…
| Total Revenues | Net Income | Net Margin |
| 26.25k | 6.45k | 24.6% |
Cash Flow Snapshot
Below shows the cash from operations, investing and financing for Applied Materials. More…
| Operations | Investing | Financing |
| 5.01k | -1.52k | -5.21k |
Balance Sheet Snapshot
Below shows the total assets, liabilities and book value per share for Applied Materials. More…
| Total Assets | Total Liabilities | Book Value Per Share |
| 27.96k | 14.54k | 14.46 |
Key Ratios Snapshot
Some of the financial key ratios for Applied Materials are shown below. More…
| 3Y Rev Growth | 3Y Operating Profit Growth | Operating Margin |
| 20.5% | 30.7% | 30.0% |
| FCF Margin | ROE | ROA |
| 15.5% | 40.3% | 17.6% |
Price History
On Thursday, global semiconductor and display manufacturing giant APPLIED MATERIALS reported its first quarter earnings results for fiscal year 2023. The results were not well-received by the market with APPLIED MATERIALS stock closing at $115.4, a 3.4% drop from its previous closing price of $119.5. At the end of the day, APPLIED MATERIALS stock was down 3.4% from its previous closing price, with investors expecting better results in the coming quarters to redeem their losses. Live Quote…
Analysis
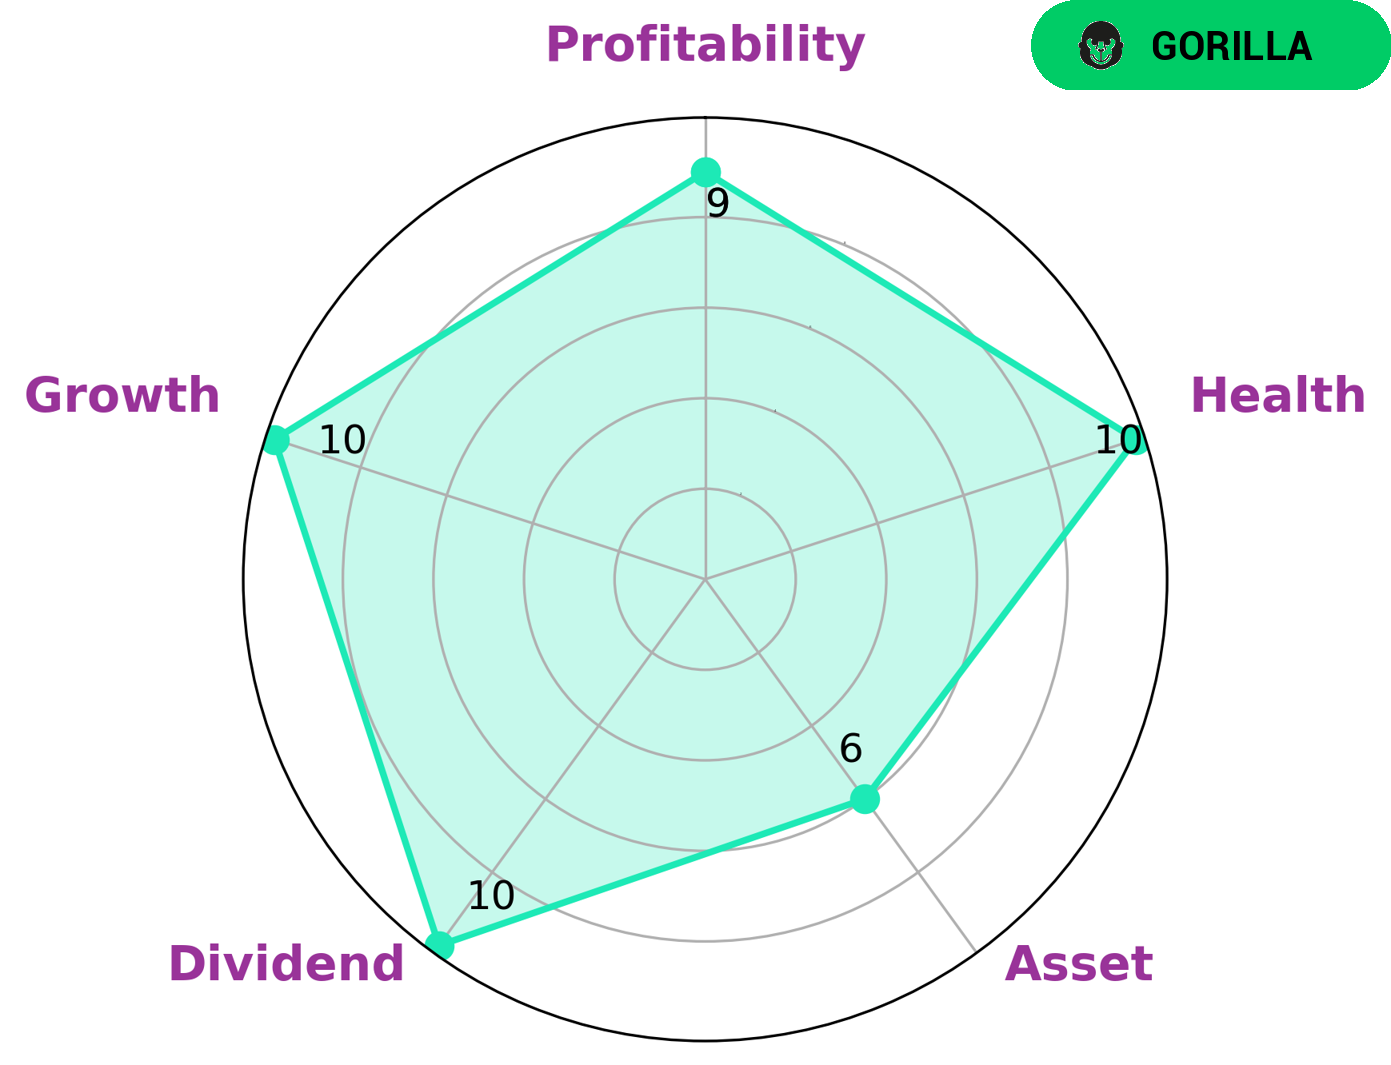
We analyzed the fundamentals of Applied Materials and based on our Star Chart we concluded that the company is strong in dividend, growth, profitability, and medium in asset. Moreover, within the framework of GoodWhale classifications Applied Materials is a ‘Gorilla’, a type of companies that achieved stable and high revenue or earnings growth due to its strong competitive advantage. When it comes to its financial health score, Applied Materials scored 10/10 on our scale. This indicates that the company is capable to pay off debt and fund future operations from its own cashflows and debt. All these make Applied Materials an attractive investment for investors looking for long-term capital gains as well as for dividend investors. More…
Peers
Applied Materials, Inc. and its competitors, Lam Research Corporation, KLA Corporation, and ASML Holding NV, compete in the semiconductor equipment industry. This industry is capital intensive, with high barriers to entry. The four companies have similar business models, but Applied Materials has a slight edge in terms of market share.
– Lam Research Corp ($NASDAQ:LRCX)
Lam Research Corporation is a company that manufactures semiconductor processing equipment. It is headquartered in Fremont, California, and has been in business since 1980. The company has a market capitalization of $51.81 billion as of 2022 and a return on equity of 54.63%. Lam Research Corporation is a leading supplier of wafer processing equipment to the semiconductor industry. The company’s products are used in the manufacturing of integrated circuits (ICs), which are the tiny electronic components that are found in everything from computers to cell phones. Lam Research Corporation’s products are used in all stages of IC production, from the initial deposition of materials on the wafer to the final etching of the completed circuits.
– KLA Corp ($NASDAQ:KLAC)
KLA Corp is a leader in process equipment and services for the semiconductor and nanoelectronics industries. The company has a market cap of $43.23 billion and a return on equity of 126.76%. KLA Corp provides products and services that enable the manufacturing of advanced semiconductor chips. The company’s products are used by customers in the fab process of making chips, including etching, metrology, and inspection. KLA Corp’s services enable customers to optimize their productivity and yield. The company has a strong history of innovation and is a trusted partner to the world’s leading chipmakers.
– ASML Holding NV ($NASDAQ:ASML)
ASML Holding NV is a technology company that manufactures semiconductor processing equipment, which is used in the production of integrated circuits (ICs). ASML’s products are used by customers in the computer, communications, and consumer electronics industries. The company has a market cap of 187.16B as of 2022 and a return on equity of 39.55%. ASML is headquartered in the Netherlands and has offices in Europe, the United States, Asia, and Japan.
Summary
APPLIED MATERIALS released its earnings report on February 16th 2023, revealing total revenue of USD 1.7 billion, a decrease of 3.9% year over year. Net income however, increased by 7.5% to USD 6.7 billion. The stock price reacted negatively on the news, indicating that investors may not be satisfied with the results.
Therefore, it is critical to analyze the company’s reports over the next few quarters to determine if the decrease in revenue is a short-term issue or an indicator of long-term instability. Further research and analysis should be conducted to understand the potential risks and opportunities in investing in APPLIED MATERIALS and be able to make informed investment decisions.
Related Posts


Recent Posts


