Journey Medical Intrinsic Value Calculator – Journey Medical Reports Impressive Q3 Results Despite Negative Earnings Per Share
May 13, 2023

Trending News ☀️
Journey Medical ($NASDAQ:DERM) Corporation recently reported its third quarter results, showing impressive performance despite a negative earnings per share (EPS). Journey Medical is a leader in the healthcare industry, focusing on providing innovative solutions to healthcare providers for their diagnostic and therapeutic needs. In their recent financial report, the company reported a non-GAAP EPS of -$0.42 and revenue of $73.7M. This exceeded analysts’ expectations by $1.09M.
Despite the negative EPS, Journey Medical’s third quarter performance was impressive. These results demonstrate the company’s continued commitment to providing innovative solutions and cost-effective services to customers in the healthcare industry.
Earnings
The total revenue of the company was 15.97M USD, with a 10.64M USD net income loss. Compared to the previous year, there was an 8.8% decrease in total revenue, but a significant increase from the 13.72M USD in the preceding two years. Overall, these results demonstrate JOURNEY MEDICAL‘s strong financial performance despite challenging market conditions.
About the Company
Income Snapshot
Below shows the total revenue, net income and net margin for Journey Medical. More…
| Total Revenues | Net Income | Net Margin |
| 73.67 | -29.63 | -40.1% |
Cash Flow Snapshot
Below shows the cash from operations, investing and financing for Journey Medical. More…
| Operations | Investing | Financing |
| -12.9 | -10 | 53.02 |
Balance Sheet Snapshot
Below shows the total assets, liabilities and book value per share for Journey Medical. More…
| Total Assets | Total Liabilities | Book Value Per Share |
| 105.16 | 88.18 | 0.96 |
Key Ratios Snapshot
Some of the financial key ratios for Journey Medical are shown below. More…
| 3Y Rev Growth | 3Y Operating Profit Growth | Operating Margin |
| 28.3% | – | -37.4% |
| FCF Margin | ROE | ROA |
| -46.3% | -79.8% | -16.4% |
Share Price
On Friday, the company’s stock opened at $1.6 and closed at the same, slightly lower than its prior closing price of 1.6 and down by 2.4%. Despite this minor decrease, Journey Medical demonstrated strong performance for the quarter, indicating potential for future growth and success. The company’s performance was driven largely by its continued focus on providing quality services to its customers and improving its operational efficiency. It is clear that Journey Medical is well positioned to capitalize on future opportunities and maintain its competitive edge in the industry. Live Quote…
Analysis – Journey Medical Intrinsic Value Calculator
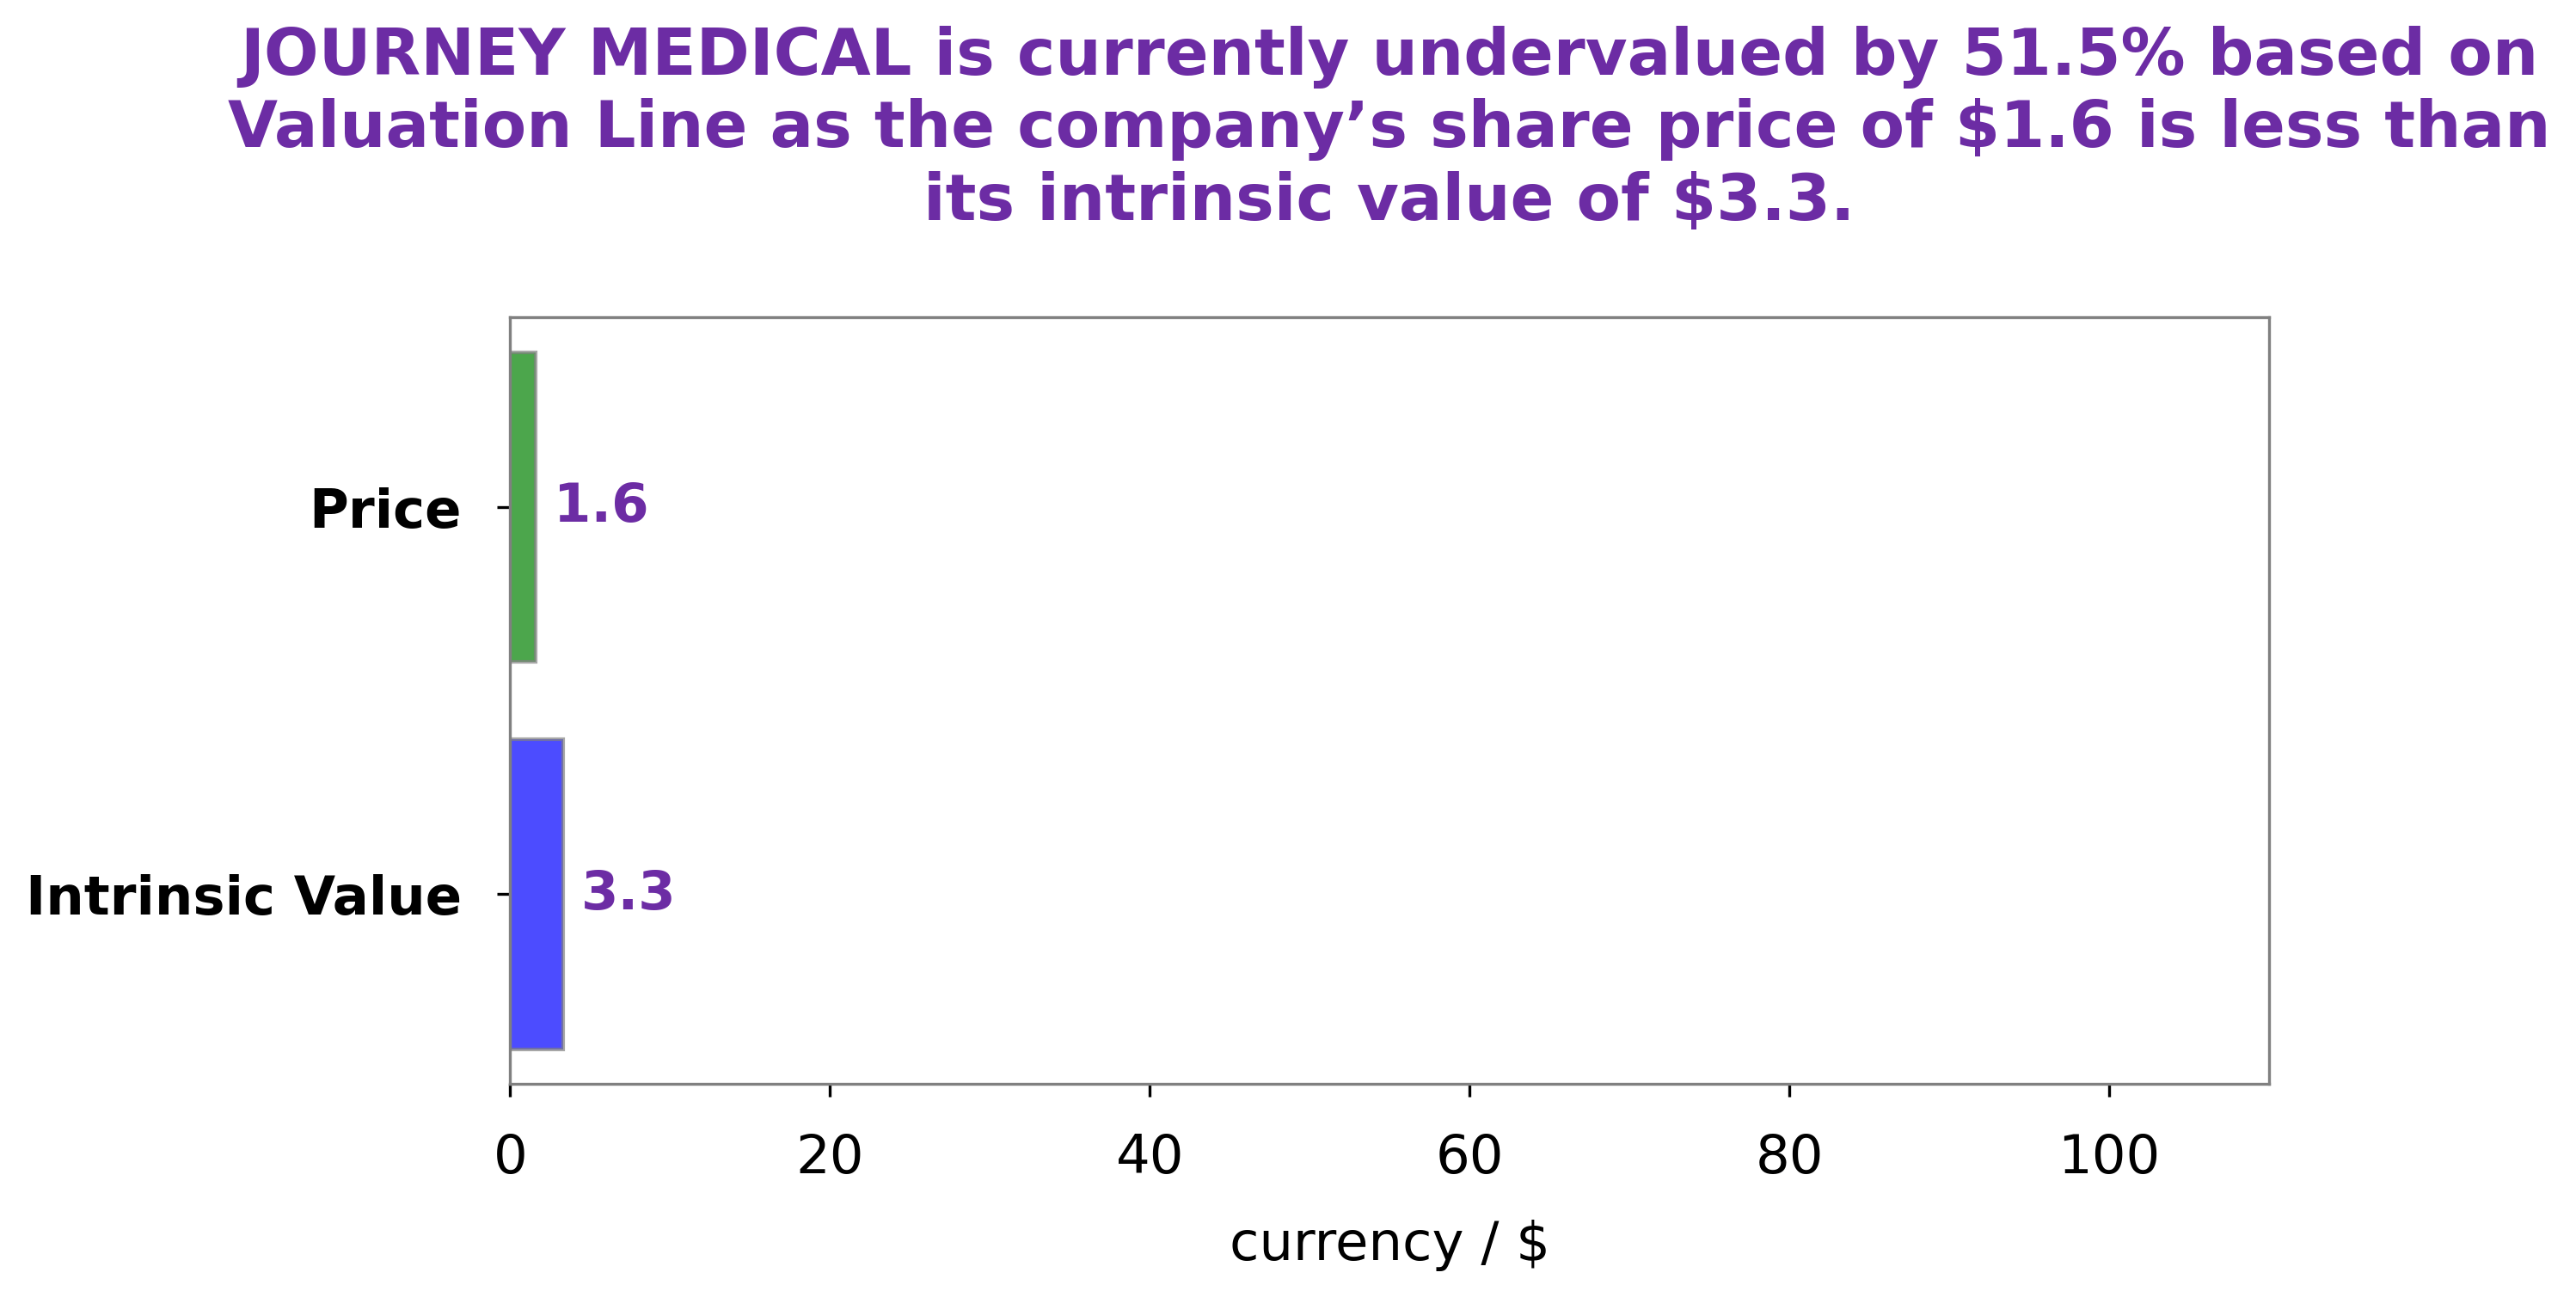
At GoodWhale, we’ve done an analysis of JOURNEY MEDICAL‘s wellbeing and our proprietary Valuation Line has determined that their fair value per share is around $3.3. However, their stock is currently trading at only $1.6 – a full 51.1% below its estimated fair value. This suggests that JOURNEY MEDICAL is currently undervalued and may be a good investment opportunity for those looking to purchase stocks in the current market. More…
Peers
Journey Medical Corp is one of the leading medical research companies in the industry, competing with several other prominent firms such as Nutri Pharmaceuticals Research Inc, Gaia Grow Corp, and CBD Life Sciences Inc. With a commitment to innovative research and development, Journey Medical Corp is dedicated to providing cutting-edge technology and treatments that make a real difference in people’s lives.
– Nutri Pharmaceuticals Research Inc ($OTCPK:NRPR)
Gaia Grow Corp is a leading provider of sustainable farming and agricultural technology solutions. The company is committed to improving the lives of farmers and helping them achieve higher yields and better quality produce. The company’s market cap of 180.18k as of 2023 reflects its successful implementation of innovative sustainable farming practices that are profitable and ecologically beneficial. Gaia Grow Corp has a strong Return on Equity (ROE) of 570.7%, indicating that their strategies and investments are generating high returns. With its strong financial performance, the company is well-positioned to continue its growth trajectory and further expand its presence in the global market.
– Gaia Grow Corp ($BER:GG00)
CBD Life Sciences Inc is a publicly traded company that specializes in the production, distribution, and sale of hemp-based products. As of 2023, the company’s market cap stands at 35.85k. This market cap provides investors with an indication of the company’s value. Additionally, the company’s Return on Equity (ROE) is -28.26%. ROE measures how well a company has been able to generate profits from its existing stockholder equity. Although the current ROE is negative, it indicates that the company has been able to put its funds in place to generate profits.
Summary
This demonstrates that despite the challenging market conditions, the company is able to generate sales and optimize its cost structure to maintain profitability. For investors, this presents an opportunity to invest in a potentially stable and growing company that has the potential to generate returns in the future.


