OLLI Intrinsic Value Calculator – OLLIE’S BARGAIN OUTLET Reports Q3 Earnings Results for FY2024 After Two-Month Delay
December 13, 2023

☀️Earnings Overview
OLLIE’S BARGAIN OUTLET ($NASDAQ:OLLI) announced on December 6 2023 their earning results for Q3 of FY2024, which ended October 31 2023. Total revenue rose 14.8% to USD 480.1 million compared to the same quarter the previous year, while net income increased 37.8% to USD 31.8 million.
Market Price
On Wednesday, OLLIE’S BARGAIN OUTLET reported its third-quarter earnings results for the fiscal year 2024 after a two-month delay. The stock opened at $78.5 and ended the day with a closing price of $76.4, representing a 0.1% increase from the previous closing price of 76.2. This was in line with analysts’ expectations, as the company continued to benefit from strong sales. The company attributed the strong performance to its cost-cutting measures and strategic pricing, which helped it maintain solid profitability despite the pandemic-related disruptions.
Furthermore, it stated that it had implemented several initiatives to refine its operations and to increase efficiency and productivity. Overall, OLLIE’S BARGAIN OUTLET’s latest earnings report showed solid progress, and the stock closed at $76.4, up 0.1% from the previous closing price. This is a promising sign for investors and demonstrates that the company is well-positioned for future success. Live Quote…
About the Company
Income Snapshot
Below shows the total revenue, net income and net margin for OLLI. More…
| Total Revenues | Net Income | Net Margin |
| 2k | 158.05 | 7.9% |
Cash Flow Snapshot
Below shows the cash from operations, investing and financing for OLLI. More…
| Operations | Investing | Financing |
| 224.23 | -198.13 | -48.65 |
Balance Sheet Snapshot
Below shows the total assets, liabilities and book value per share for OLLI. More…
| Total Assets | Total Liabilities | Book Value Per Share |
| 2.19k | 753.99 | 23.34 |
Key Ratios Snapshot
Some of the financial key ratios for OLLI are shown below. More…
| 3Y Rev Growth | 3Y Operating Profit Growth | Operating Margin |
| 5.3% | -8.4% | 9.9% |
| FCF Margin | ROE | ROA |
| 6.5% | 8.7% | 5.6% |
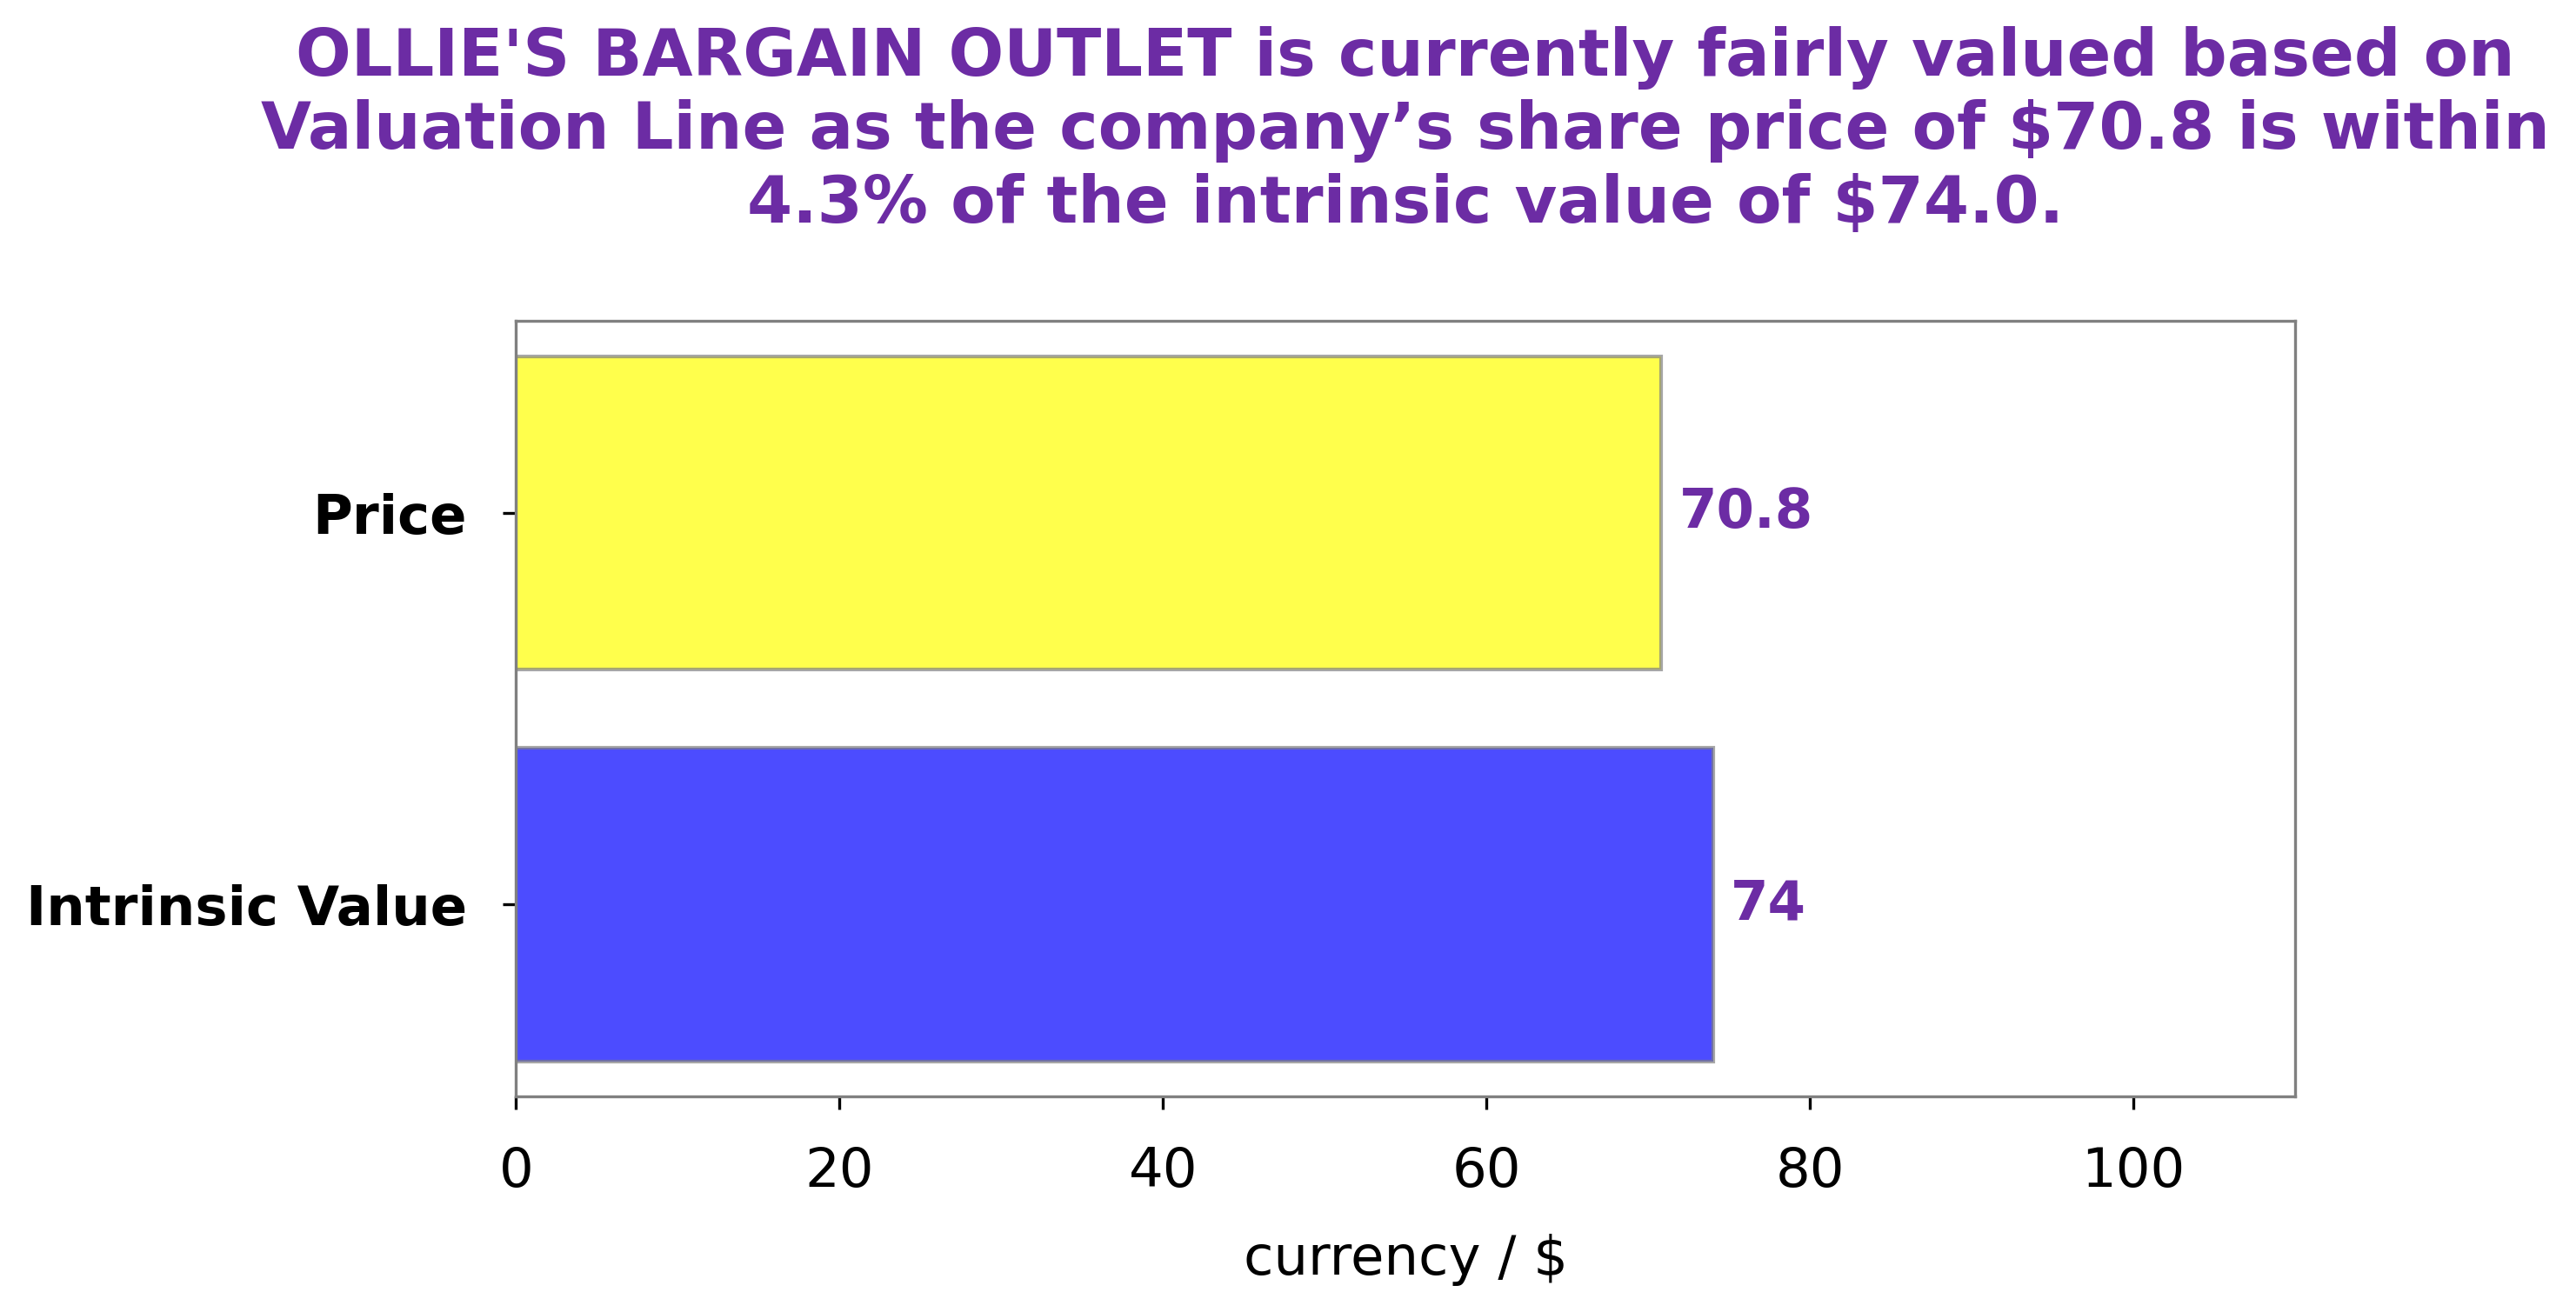
Analysis – OLLI Intrinsic Value Calculator
At GoodWhale, we have analyzed the fundamentals for OLLIE’S BARGAIN OUTLET with our proprietary Valuation Line and found that its intrinsic value is around $74.2. Looking at the current trading price of OLLIE’S BARGAIN OUTLET stock at $76.4, we can see that the stock is fairly priced but slightly overvalued by 3.0%. As OLLIE’S BARGAIN OUTLET is trading above its intrinsic value, investors may want to evaluate their investment strategies and decide if they want to buy, sell or hold onto the stock. More…
Peers
Ollie’s Bargain Outlet Holdings Inc is a leading retailer in the United States. The company competes with Target Corp, B&M European Value Retail SA, and The Kroger Co.
– Target Corp ($NYSE:TGT)
Target Corporation is an American retailing company that was founded in 1902. It is the second-largest discount retailer in the United States, behind Walmart. As of 2022, Target’s market cap is 68.69B and its ROE is 34.09%. Target Corporation operates 1,851 stores in the United States. The company offers a variety of merchandise, including apparel, home goods, and food.
– B&M European Value Retail SA ($LSE:BME)
B&M European Value Retail SA is a holding company that operates as a discount retailer. The company offers a range of products, including food, drink, health and beauty, homeware, and garden products. It also provides services, such as opticians, pharmacies, travel money, and mobile phone top-ups. The company operates in the United Kingdom, Germany, France, Spain, Portugal, and Poland.
– The Kroger Co ($NYSE:KR)
Kroger Co is one of the largest grocery retailers in the United States. The company has a market capitalization of $30.14 billion as of 2022 and a return on equity of 23.61%. Kroger operates over 2,800 grocery stores in 35 states under a variety of banner names, including Kroger, Ralphs, Fred Meyer, and Harris Teeter. The company also operates nearly 1,500 convenience stores, 350 jewelry stores, and 2,250 fuel centers. Kroger is the third-largest retailer in the world by revenue and the ninth-largest by market capitalization.
Summary
Ollie’s Bargain Outlet reported a positive third quarter performance for FY2024, with total revenue increasing by 14.8% year-on-year to USD 480.1 million and net income up 37.8% to USD 31.8 million. The company has shown strong quarterly results, and investors may be attracted to the company’s growing revenue and profitability. As such, Ollie’s Bargain Outlet may present a potential investment opportunity for those seeking a strong return on their investments.


