Qiagen Nv Intrinsic Value Calculation – QIAGEN NV Reports Second Quarter Earnings Results for 2023
August 15, 2023

🌥️Earnings Overview
On August 10th, 2023, QIAGEN NV ($NYSE:QGEN) reported their earnings results for the second quarter of the fiscal year 2023. Total revenue for the period decreased by 4.0%, coming in at USD 494.9 million compared to the same quarter in the previous year. Additionally, their net income decreased by 16.4% year-over-year, amounting to USD 80.8 million.
Stock Price
The stock opened at $44.5 and closed at $44.3, representing a decrease of 0.9% from its previous closing price of 44.7. Despite the slight decline, the company had a notably successful quarter with many impressive achievements. These impressive results were driven by strong performance in the company’s molecular diagnostics and applied testing businesses. QIAGEN NV also reported growth in its customer base and an increase in customer engagement.
Overall, QIAGEN NV posted a remarkable quarter with impressive revenue and earnings growth. The company continues to benefit from its strong customer base and increased customer engagement, setting it up for continued success in the future. Live Quote…
About the Company
Income Snapshot
Below shows the total revenue, net income and net margin for Qiagen Nv. More…
| Total Revenues | Net Income | Net Margin |
| 1.98k | 337.06 | 19.1% |
Cash Flow Snapshot
Below shows the cash from operations, investing and financing for Qiagen Nv. More…
| Operations | Investing | Financing |
| 519.3 | -446.54 | -163.65 |
Balance Sheet Snapshot
Below shows the total assets, liabilities and book value per share for Qiagen Nv. More…
| Total Assets | Total Liabilities | Book Value Per Share |
| 6.35k | 2.72k | 15.88 |
Key Ratios Snapshot
Some of the financial key ratios for Qiagen Nv are shown below. More…
| 3Y Rev Growth | 3Y Operating Profit Growth | Operating Margin |
| 7.1% | 2.8% | 23.9% |
| FCF Margin | ROE | ROA |
| 19.0% | 8.2% | 4.6% |
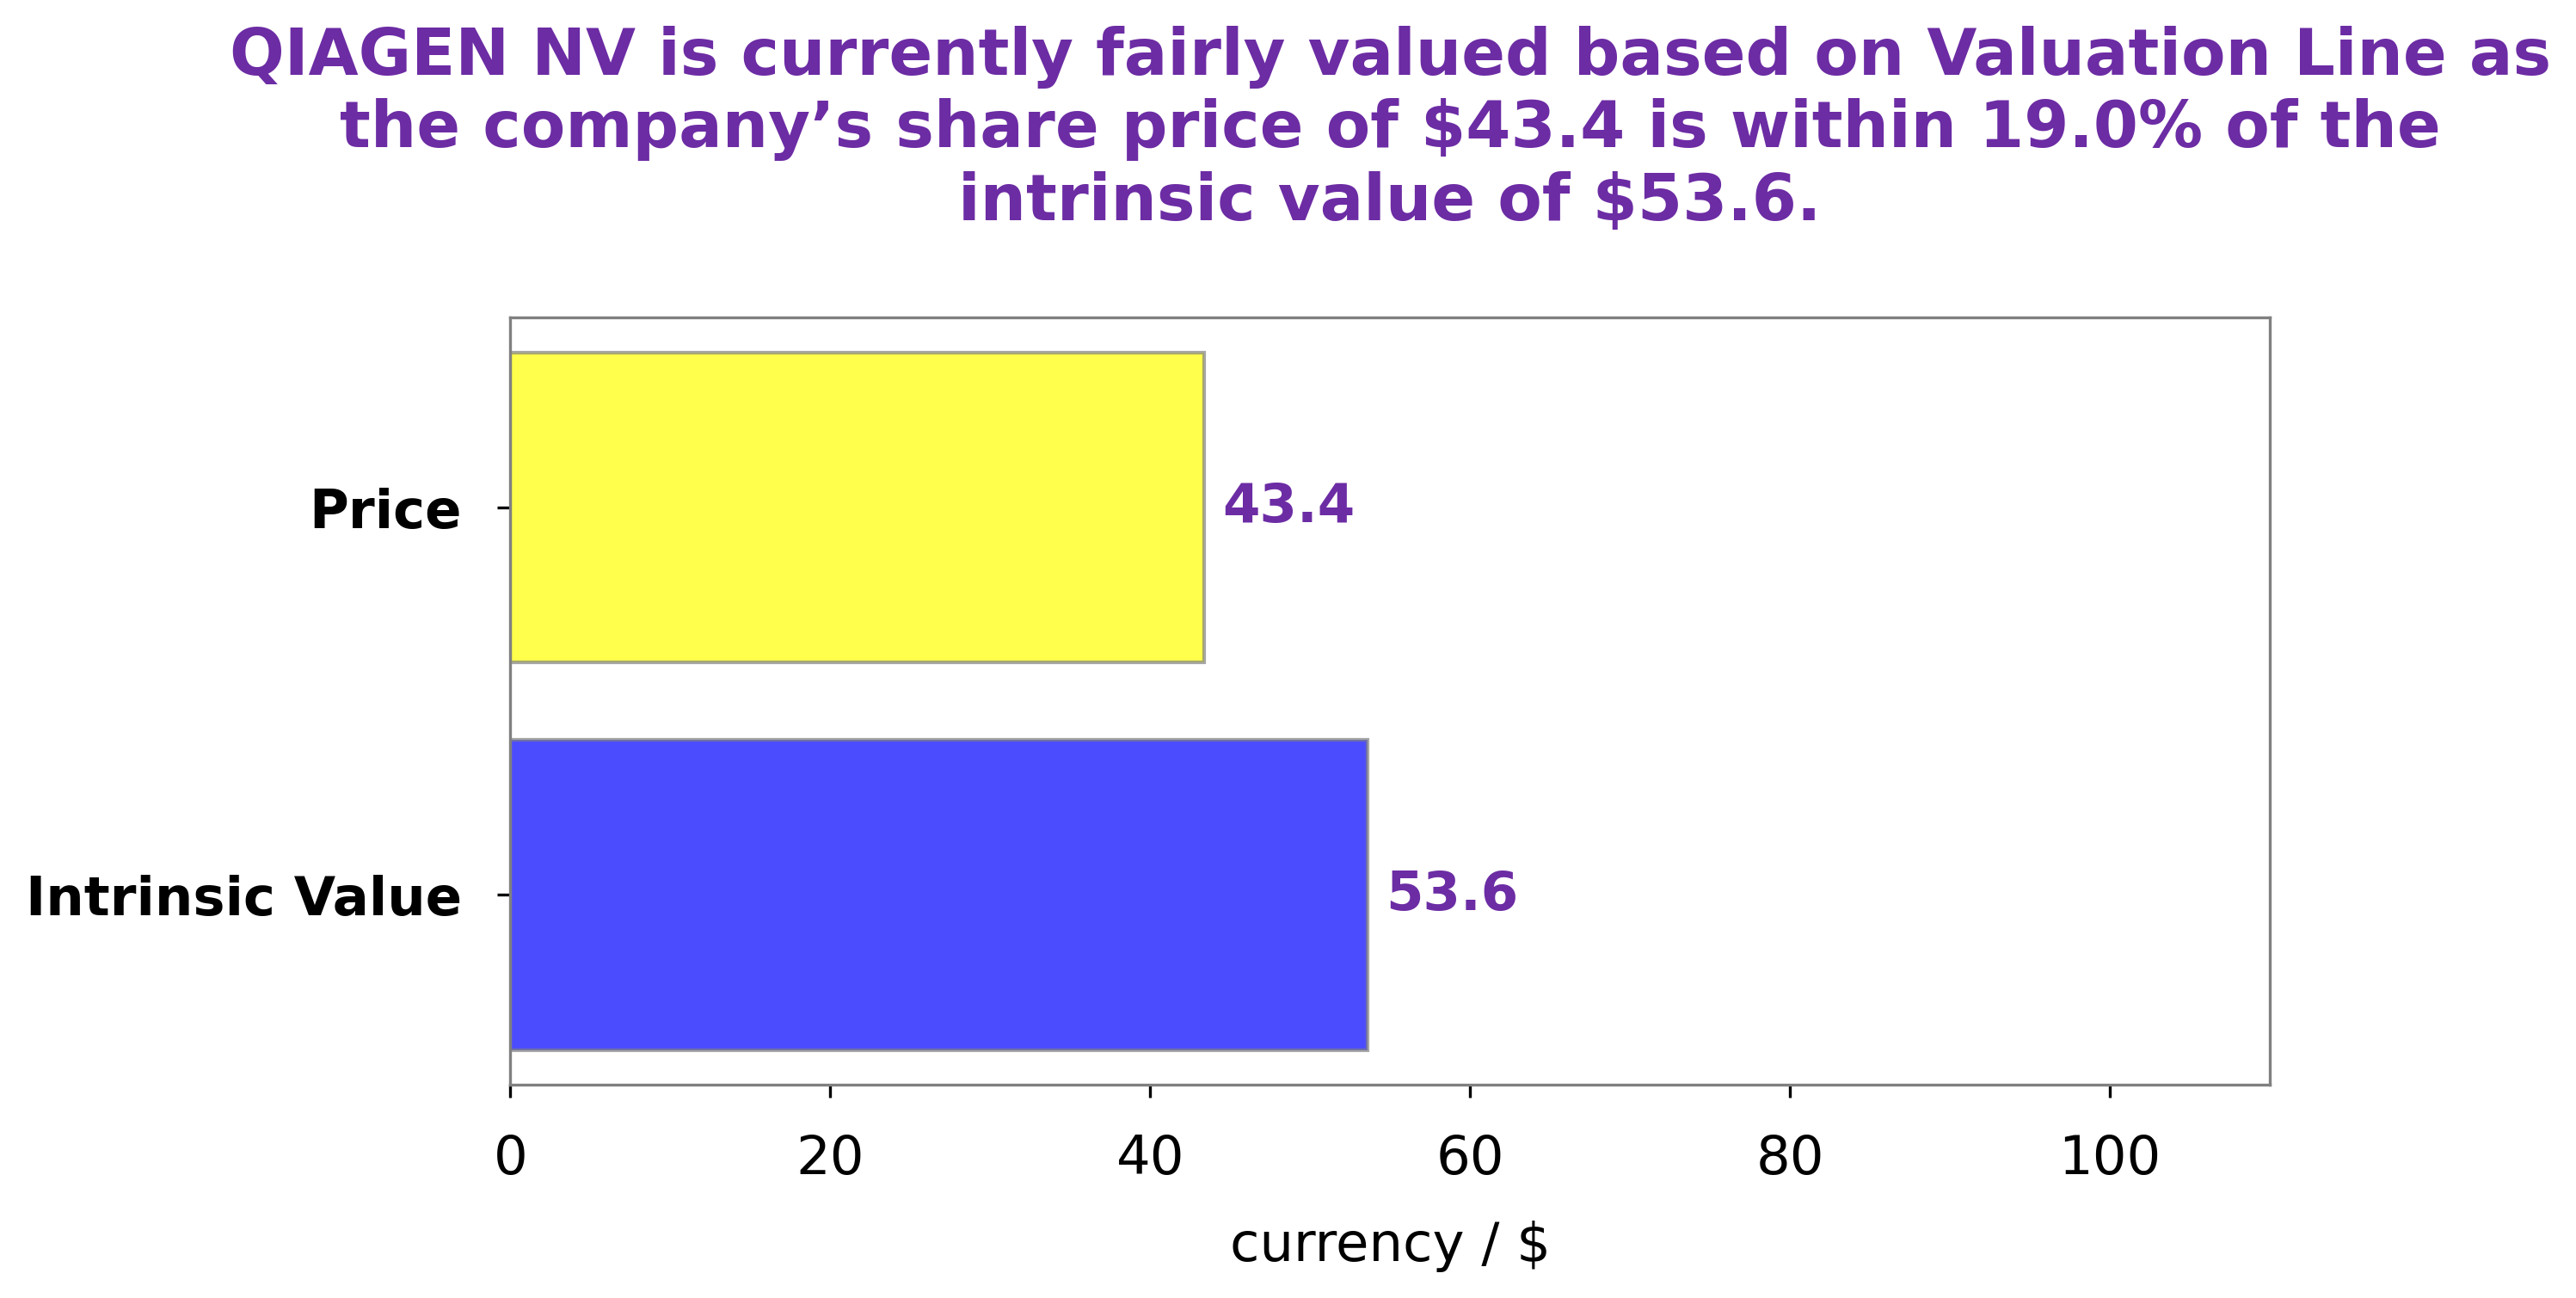
Analysis – Qiagen Nv Intrinsic Value Calculation
GoodWhale has conducted an analysis of QIAGEN NV‘s wellbeing and the results are presented below. Our proprietary Valuation Line has calculated the fair value of QIAGEN NV shares to be around $56.0. Currently, the stock is trading at $44.3, which represents an undervaluation of 20.9%. This suggests that there may be an opportunity to buy into the company at a discount. Investors should do their own due diligence before taking any action, as market conditions can change rapidly. More…
Peers
In the market for molecular diagnostics, Qiagen NV faces competition from BioMerieux SA, Agilent Technologies Inc, and Diasorin SpA. These companies offer a range of products and services that are similar to Qiagen NV’s offerings.
– BioMerieux SA ($OTCPK:BMXMF)
Found in 1963, BioMérieux is a French multinational corporation that produces medical diagnostic systems. The company is headquartered in Lyon and has over 11,000 employees in 43 countries.
In terms of market cap, BioMérieux is a large company with a market cap of over 10 billion as of 2022. The company’s return on equity is also strong, at 13.56%.
BioMérieux produces medical diagnostic systems that are used in a variety of settings, including hospitals, clinics, and laboratories. The company’s products are used to diagnose a wide range of conditions, including infections, cancer, and cardiovascular disease.
– Agilent Technologies Inc ($NYSE:A)
Agilent Technologies Inc is a leading global provider of scientific instruments, software, services, and solutions. The company serves the life sciences, diagnostics, and applied chemical markets. Agilent has a market cap of $37.28B as of 2022 and a ROE of 19.27%. The company’s products and services are used by customers in a wide range of industries, including academic and government institutions, pharmaceutical and biotechnology companies, and commercial laboratories.
– Diasorin SpA ($LTS:0GZX)
Diasorin SpA is a publicly traded company with a market capitalization of 6.94B as of 2022. The company has a strong return on equity of 17.96%. Diasorin is engaged in the research, development, and manufacture of diagnostic tests for a number of diseases and conditions. The company’s products are sold in over 60 countries worldwide.
Summary
Investors should take note of QIAGEN NV‘s second quarter earnings report for the period ended June 30, 2023. Total revenue for the quarter was USD 494.9 million, a decrease of 4.0% year over year. Net income for the quarter was USD 80.8 million, down 16.4% from the same period in the previous year. Despite this decline, QIAGEN NV has continued to maintain good profitability and healthy cash flow.
Investors should watch for any indications of future operational progress, including product launches, strategic acquisitions or partnerships, and new markets and applications. In the meantime, they should continue to monitor the stock trend for any signs of a recovery in value.


