PERKINELMER Reports Fourth Quarter FY2022 Earnings Results for February 14, 2023.
March 1, 2023

Earnings report
PERKINELMER ($NYSE:PKI): 2 % y e a r o v e r y e a r . D e s p i t e t h e y e a r – o v e r – y e a r d e c r e a s e , t h e c o m p a n y i s o p t i m i s t i c t h a t b u s i n e s s c o n d i t i o n s w i l l i m p r o v e i n t h e f u t u r e a n d b e l i e v e s t h a t s t r o n g p e r f o r m a n c e i n n e w p r o d u c t d e v e l o p m e n t w i l l h e l p d r i v e f u t u r e g r o w t h.
Stock Price
On Tuesday, February 14th, 2023, PERKINELMER reported positive fourth quarter fiscal year 2022 earnings results. The stock opened at $141.5 and closed at $138.0, representing a decline of 0.5% from the previous closing price of $138.7. Despite the slight decrease, analysts recognize that PERKINELMER’s fourth quarter results have been largely positive, indicating a strong outlook for the company in the future. PERKINELMER’s performance in the fourth quarter reflects its overall fiscal success throughout the year, as the company continues to invest in innovative solutions and strategies that address customer needs and keep them at the forefront of their respective industries. Live Quote…
About the Company
Income Snapshot
Below shows the total revenue, net income and net margin for Perkinelmer. More…
| Total Revenues | Net Income | Net Margin |
| 3.31k | 579.18 | 16.2% |
Cash Flow Snapshot
Below shows the cash from operations, investing and financing for Perkinelmer. More…
| Operations | Investing | Financing |
| 679.81 | -132.85 | -661.8 |
Balance Sheet Snapshot
Below shows the total assets, liabilities and book value per share for Perkinelmer. More…
| Total Assets | Total Liabilities | Book Value Per Share |
| 14.13k | 6.73k | 55.98 |
Key Ratios Snapshot
Some of the financial key ratios for Perkinelmer are shown below. More…
| 3Y Rev Growth | 3Y Operating Profit Growth | Operating Margin |
| 4.7% | 23.8% | 22.8% |
| FCF Margin | ROE | ROA |
| 17.9% | 6.7% | 3.3% |
Analysis
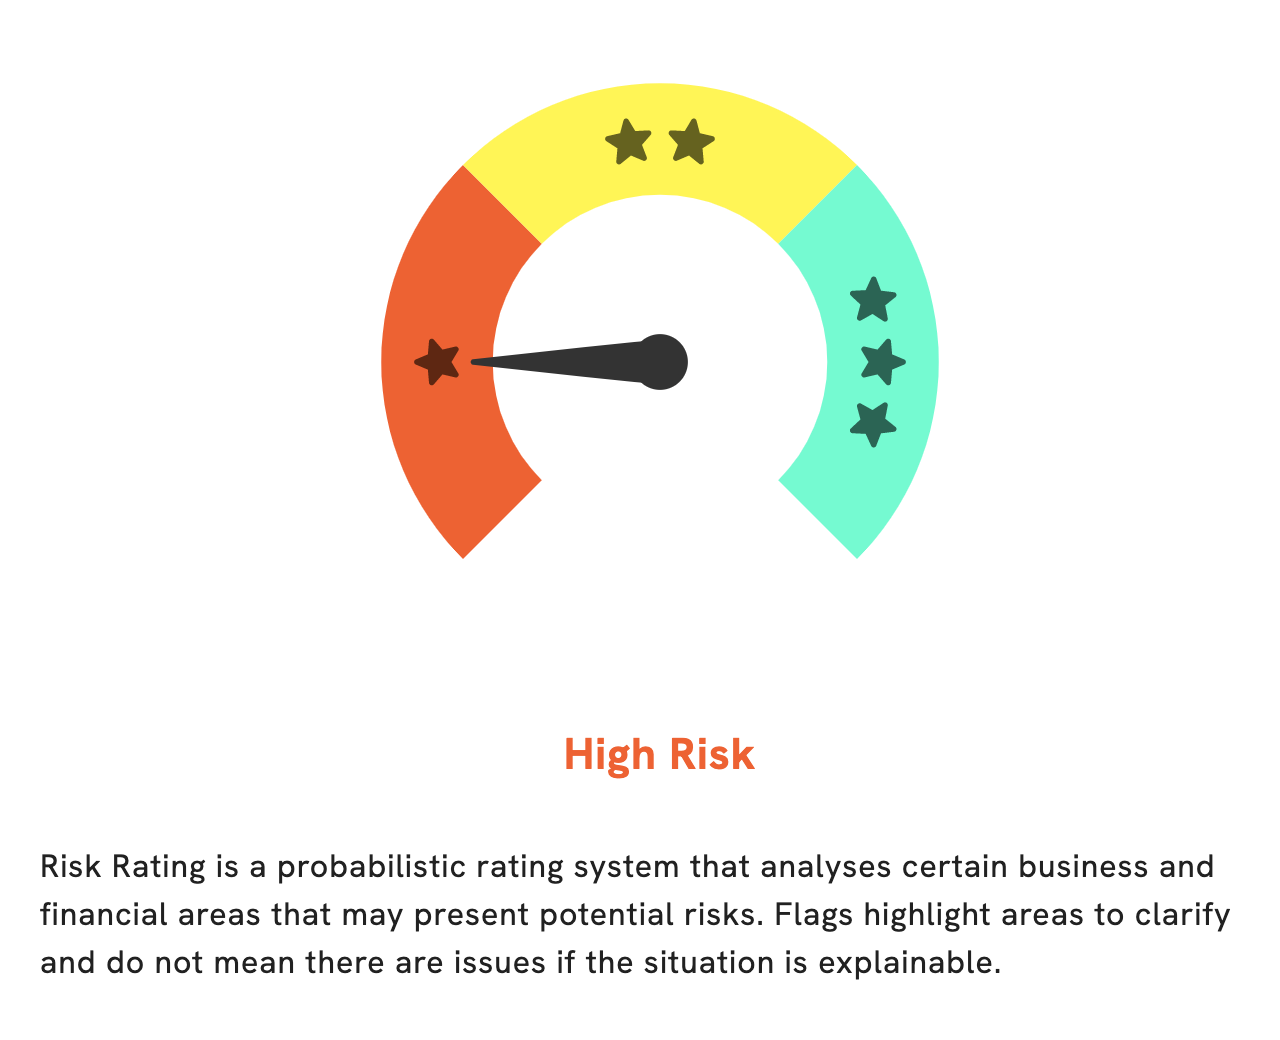
At GoodWhale, we have conducted an in-depth financial analysis of PERKINELMER. Based on the results, we have assigned PERKINELMER a high risk rating in terms of its financial and business prospects. Our risk assessment system takes into account a wide range of data sources, including balance sheet and non-financial journal items. Upon closer inspection of PERKINELMER’s financials, we have detected three specific risk warning indicators that are worthy of further investigation. Our sophisticated tracking system capabilities alert us to any potential threats that could affect the long-term financial stability of the company. If you wish to access further details on these risks and to better understand how they may impact the performance of PERKINELMER, please become a registered user on our platform. Our wealth of data and analysis will give you valuable insight into the financial status of PERKINELMER, enabling you to make informed investing decisions. More…
Peers
The company has a strong portfolio of products and services, which it uses to compete against its rivals, SenzaGen AB, Shanghai Rendu Biotechnology Co Ltd, and Charles River Laboratories International Inc. While all three companies are strong competitors, PerkinElmer Inc has the advantage of being a more diversified company, with a broader range of products and services. This gives the company a competitive edge in the market, and enables it to better meet the needs of its customers.
– SenzaGen AB ($SHSE:688193)
Shanghai Rendu Biotechnology Co Ltd is a Chinese biotechnology company with a market cap of 1.94B as of 2022. The company has a Return on Equity of 3.93%. Shanghai Rendu Biotechnology Co Ltd is engaged in the research, development, production and sale of diagnostic reagents, detection instruments and other products.
– Shanghai Rendu Biotechnology Co Ltd ($NYSE:CRL)
As of 2022, Charles River Laboratories International Inc. had a market cap of 10.63 billion and a return on equity of 13.86%. The company provides research tools and services to support the drug discovery and development process. Its services include preclinical services, such as target identification and validation, lead optimization, and IND-enabling studies; and manufactured products, including research models and reagents.
Summary
PerkinElmer Inc. experienced a decrease in both revenue and income during the most recent quarter compared to the same quarter from the previous year. Total revenue for the period was USD 137.7 million, a decrease of 23.2%, and net income was reported as USD 741.2 million, a decrease of 45.7%. This overall reduction in performance may be cause for concern amongst current investors, as it could indicate that the company is facing financial difficulty in the short term. As a potential investor, it is important to conduct additional research and assessment of the company’s current financial situation before making any investment decisions.
Related Posts


Recent Posts


