AGILENT TECHNOLOGIES Reports Record Third Quarter Earnings for FY2023
August 25, 2023

🌥️Earnings Overview
For the third quarter of FY2023, AGILENT TECHNOLOGIES ($NYSE:A) saw a total revenue of USD 1672.0 million, a 2.7% decline from the same period in FY2022. Additionally, net income dropped by 66.3%, decreasing to USD 111.0 million. This report corresponds to the period ending July 31 2023.
Market Price
On Tuesday, AGILENT TECHNOLOGIES reported record third quarter earnings for FY2023. The stock opened at $126.3 and closed at $125.6, down by 0.8% from the prior closing price of 126.6. AGILENT TECHNOLOGIES also experienced an increase in demand for their products during the pandemic period when lockdowns were in place. This allowed the company to benefit from increased sales of products such as chromatography systems, automation instruments and spectroscopy instruments.
CEO Mike McMullen attributes this success to the company’s focus on long-term investments and their commitment to providing innovative solutions that meet customer needs. This success is also attributed to their strategy of targeting emerging markets and expanding into adjacent markets. AGILENT TECHNOLOGIES is confident that these strategies will continue to drive growth in the future. Live Quote…
About the Company
Income Snapshot
Below shows the total revenue, net income and net margin for Agilent Technologies. More…
| Total Revenues | Net Income | Net Margin |
| 6.99k | 1.13k | 16.2% |
Cash Flow Snapshot
Below shows the cash from operations, investing and financing for Agilent Technologies. More…
| Operations | Investing | Financing |
| 1.7k | -380 | -1.07k |
Balance Sheet Snapshot
Below shows the total assets, liabilities and book value per share for Agilent Technologies. More…
| Total Assets | Total Liabilities | Book Value Per Share |
| 10.68k | 5.12k | 18.97 |
Key Ratios Snapshot
Some of the financial key ratios for Agilent Technologies are shown below. More…
| 3Y Rev Growth | 3Y Operating Profit Growth | Operating Margin |
| 10.2% | 21.0% | 21.0% |
| FCF Margin | ROE | ROA |
| 20.3% | 16.2% | 8.6% |
Analysis
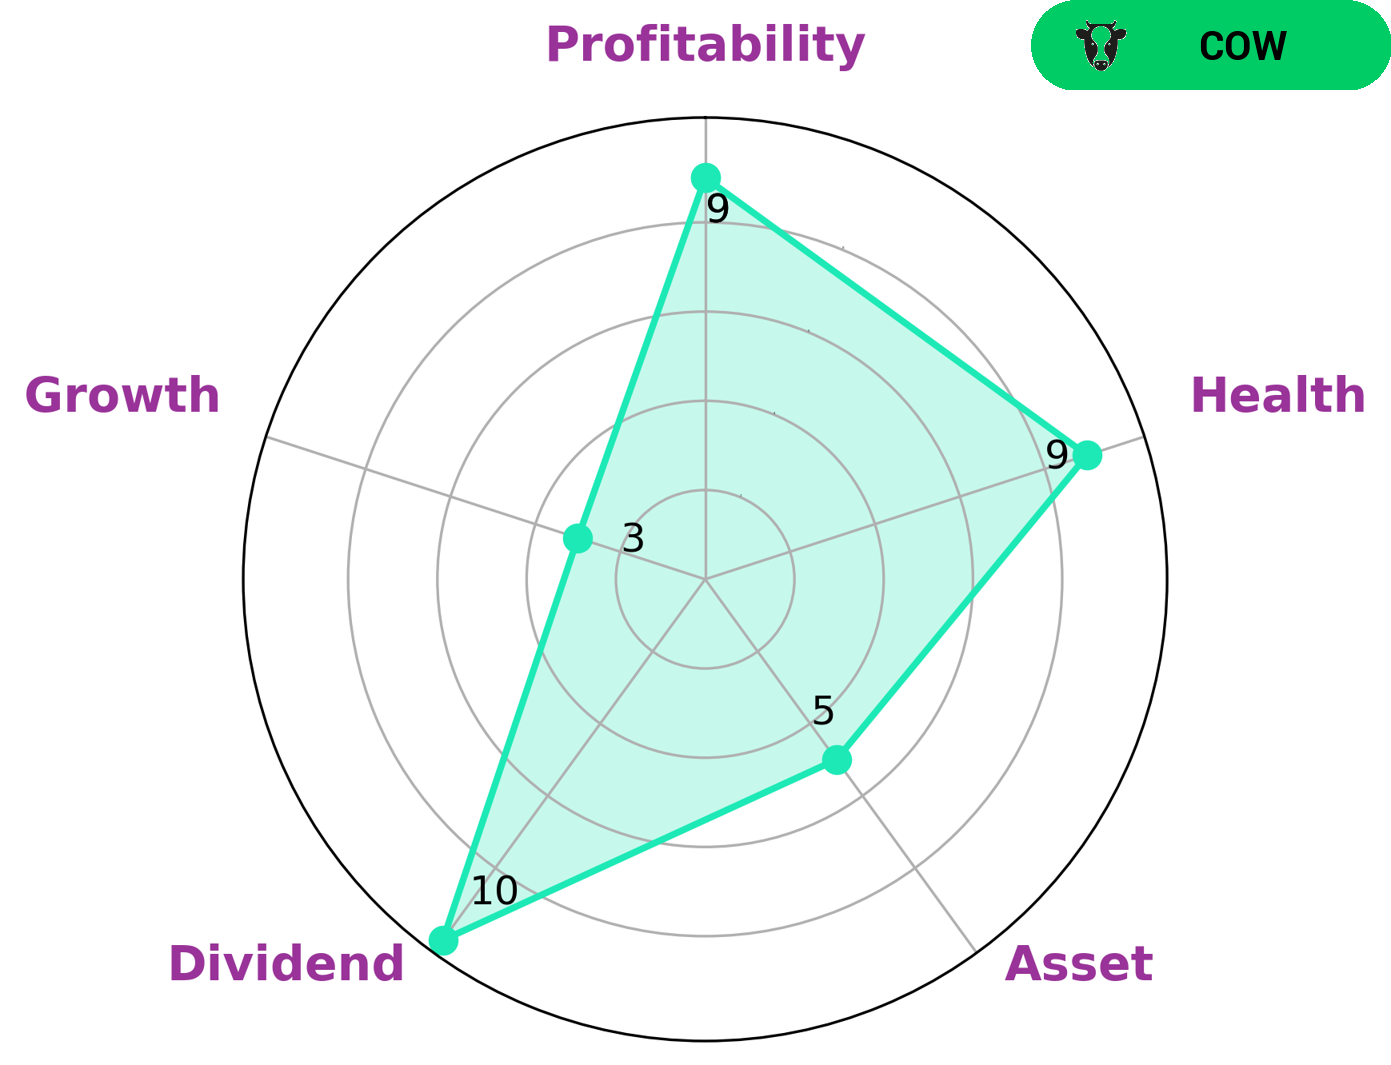
At GoodWhale, we have conducted an in-depth analysis of the fundamentals of AGILENT TECHNOLOGIES. According to our analysis, AGILENT TECHNOLOGIES is classified as a ‘gorilla’ company. This type of company is characterized by stable and high revenue or earning growth due to its strong competitive advantage. As such, AGILENT TECHNOLOGIES is likely to be of particular interest to investors looking for a solid long-term investment. AGILENT TECHNOLOGIES has a strong financial health score of 9/10 with regards to its cash flows and debt, indicating that the company will be able to sustain future operations in times of crisis. Furthermore, AGILENT TECHNOLOGIES scores highly on dividend returns, profitability, and moderately on asset growth. More…
Peers
The company has a strong presence in the market and competes with Qiagen NV, Thermo Fisher Scientific Inc, Illumina Inc, and other companies. Agilent Technologies Inc. is committed to providing innovative products and services that meet the needs of customers and enable them to achieve their research goals.
– Qiagen NV ($NYSE:QGEN)
Qiagen is a Dutch company that provides molecular diagnostic solutions, including kits and instruments for sample preparation and real-time PCR. The company has a market cap of 9.99B as of 2022 and a ROE of 13.07%.
– Thermo Fisher Scientific Inc ($NYSE:TMO)
Thermo Fisher Scientific Inc is a biotechnology company that manufactures and sells scientific instruments, reagents, and laboratory products. The company has a market capitalization of 201.37 billion as of 2022 and a return on equity of 12.43%. Thermo Fisher Scientific is a global leader in serving science, with revenues of more than $30 billion and a workforce of more than 70,000 employees. The company’s mission is to enable its customers to make the world healthier, cleaner, and safer.
– Illumina Inc ($NASDAQ:ILMN)
Illumina Inc. is an American company headquartered in San Diego, California. It is a provider of sequencing and array-based solutions for genetic analysis. The company has a market cap of $36.65 billion as of 2022 and a return on equity of 0.28%. Illumina’s products are used by academic and commercial researchers in a variety of fields, including cancer, infectious disease, genetics, and more.
Summary
Investing in AGILENT TECHNOLOGIES has shown a decrease in their third quarter earnings for FY2023 when compared to the same period last year. Revenue has dropped by 2.7% to USD 1672.0 million and net income has dropped by 66.3% to USD 111.0 million. This could indicate disappointing stock performance in the future, making this a risky investment. Investors should do their own research and take into consideration the company’s current financial state before making any decisions.
Related Posts


Recent Posts


