MACY’S Reports Second Quarter FY2024 Earnings Results on July 31 2023
August 24, 2023

🌥️Earnings Overview
On August 22, 2023, MACY’S ($NYSE:M) reported their second-quarter fiscal year 2024 earnings results with total revenue of USD 5280.0 million, representing a 9.0% decrease year-over-year. Net income for the period was USD -22.0 million, compared to USD 275.0 million in the prior year.
Market Price
On Tuesday, July 31 2023, MACY’S reported its second quarter fiscal year 2024 earnings results. At the open, MACY’s stock was valued at $13.6 a share but by the close of the market, it had plunged by 14.1%, to a closing price of $12.7 per share. The plunge was a steep decline from its previous closing price of 14.7. The drastic fall in MACY’s stock is indicative of the market’s reaction to the second quarter earnings report. It is important to note that this is not the first time MACY’s has had a significant stock drop; however, investors may still be concerned about this particular report. The company has yet to release details of what information was included in the report but more information should be released soon.
Many analysts are predicting that MACY’s has not yet seen the end of its stock slump. If the company does not deliver positive results in the coming quarters, investors may be more inclined to sell their stock in favour of more promising investments. Overall, it will be interesting to see how MACY’s stock performance will play out over the coming quarters and whether it will show any signs of improvement or continue to decline. Investors will certainly be watching closely to see if they should keep or sell their MACY’s stock. Live Quote…
About the Company
Income Snapshot
Below shows the total revenue, net income and net margin for Macy’s. More…
| Total Revenues | Net Income | Net Margin |
| 24.41k | 749 | 3.0% |
Cash Flow Snapshot
Below shows the cash from operations, investing and financing for Macy’s. More…
| Operations | Investing | Financing |
| 1.58k | -1.19k | -260 |
Balance Sheet Snapshot
Below shows the total assets, liabilities and book value per share for Macy’s. More…
| Total Assets | Total Liabilities | Book Value Per Share |
| 16.3k | 12.09k | 15.3 |
Key Ratios Snapshot
Some of the financial key ratios for Macy’s are shown below. More…
| 3Y Rev Growth | 3Y Operating Profit Growth | Operating Margin |
| 5.5% | 14.2% | 4.5% |
| FCF Margin | ROE | ROA |
| 1.3% | 16.5% | 4.2% |
Analysis
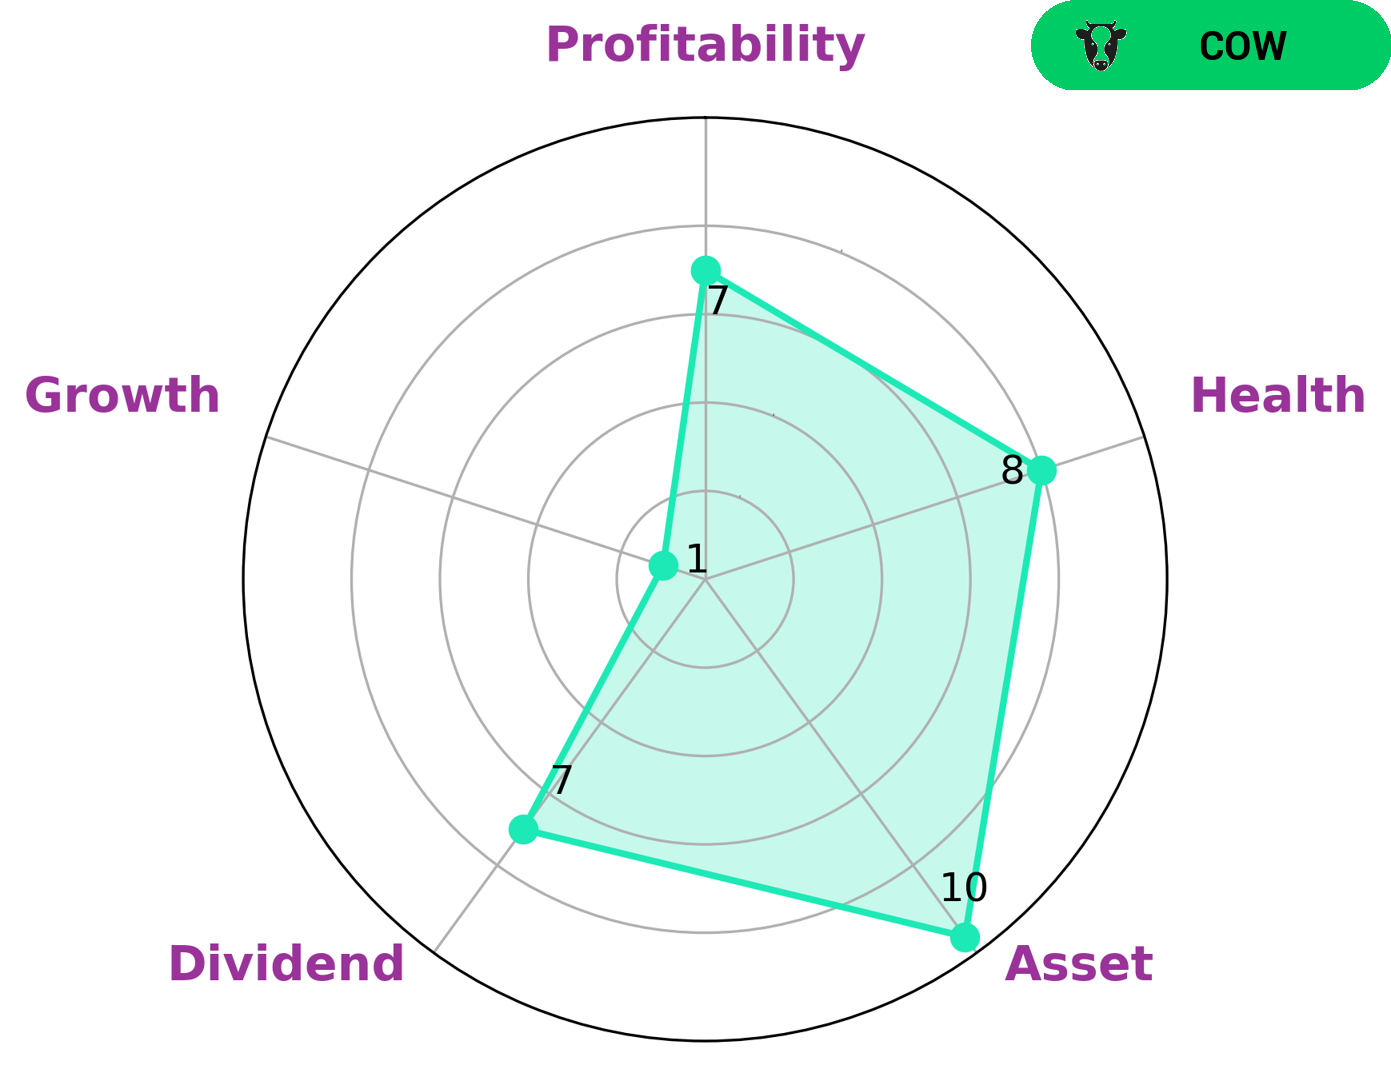
At GoodWhale, we have performed an analysis of MACY’S finances. According to our Star Chart, the company holds a high health score of 8/10, indicating that its cash flows and debt are in good shape and it is capable of riding out any potential crisis without the risk of bankruptcy. Further, when we looked at the company’s individual metrics, we found that it was strong in asset, dividend, and medium in profitability and weak in growth. Based on our analysis, we classified MACY’S as a ‘cow’ company – one that has a track record of paying out consistent and sustainable dividends. Therefore, this type of company may be particularly attractive to investors who are looking for an opportunity to gain steady returns through dividends. The company’s robust financials make it an ideal option for investors seeking stability and dependability. More…
Peers
Macy’s Inc, World Co Ltd, Kohl’s Corp, and PT Ramayana Lestari Sentosa Tbk are all retail companies.
– World Co Ltd ($TSE:3612)
As of 2022, World Co Ltd has a market cap of 46.04B and a Return on Equity of 4.14%. The company is engaged in the business of providing online services. It offers a range of services, including online search, advertising, maps, software applications, and cloud computing.
– Kohl’s Corp ($NYSE:KSS)
Kohl’s Corp is an American department store retail chain. The company has a market capitalization of $3.56 billion as of 2022 and a return on equity of 16.46%. Kohl’s operates 1,158 stores in 49 states. The company offers a wide variety of merchandise, including apparel, shoes, cosmetics, and home goods. Kohl’s is known for its discount pricing and extensive promotions.
– PT Ramayana Lestari Sentosa Tbk ($IDX:RALS)
Ramayana Lestari Sentosa Tbk is an Indonesian conglomerate with interests in retail, malls, and real estate. The company has a market cap of 3.67 trillion as of 2022 and a return on equity of 6.89%. The company was founded in 1973 and is headquartered in Jakarta, Indonesia.
Summary
MACY’S reported their earnings for the second quarter of FY2024 on July 31 2023. Total revenue decreased by 9.0% to USD5280.0 million and net income decreased to a negative USD22.0 million, compared to the previous year’s positive USD275.0 million. As a result, stock prices dropped significantly the same day.
Investors should be aware of the recent developments in this company before making any decisions to invest. They should look for potential signs of improvement in future earnings, as well as consider other factors such as the company’s competitive position, financial outlook, and market trends.
Related Posts


Recent Posts


