APPLE INC Reports Record Earnings for Q3 of Fiscal Year 2023
August 15, 2023

🌥️Earnings Overview
On August 3 2023, APPLE INC ($NASDAQ:AAPL) reported its earnings results for the third quarter of FY2023, which concluded on June 30 2023. The company achieved total revenue of USD 81.8 billion, a slight decrease of 1.4% compared to the same quarter of the previous year. Net income, however, saw an increase of 2.3% year over year, coming in at USD 19.9 billion.
Market Price
On Thursday, APPLE INC reported record earnings for Q3 of fiscal year 2023, with their stock price opening at $191.6 and closing at $191.2, a decrease of 0.7% from its previous closing price of 192.6. With these impressive earnings, APPLE INC managed to break their previous records set in the same quarter of the previous year. The company continues to remain a leader in the technology industry, despite the current uncertain economic climate. The company’s strong performance was driven by their ability to successfully capture new market share in both their established and emerging markets. APPLE INC has continued to develop innovative products and services that meet customer demand while also providing value for shareholders.
In addition, APPLE INC has successfully rolled out new platforms and services that have been widely adopted by customers, further increasing their foothold in the technology industry. With their impressive earnings report, APPLE INC has once again demonstrated its resilience and financial strength even in difficult times. The company’s ability to stay ahead of industry trends and capitalize on opportunities has allowed them to remain a leader in the technology sector. Live Quote…
About the Company
Income Snapshot
Below shows the total revenue, net income and net margin for Apple Inc. More…
| Total Revenues | Net Income | Net Margin |
| 383.93k | 94.76k | 24.7% |
Cash Flow Snapshot
Below shows the cash from operations, investing and financing for Apple Inc. More…
| Operations | Investing | Financing |
| 113.07k | 94 | -112.13k |
Balance Sheet Snapshot
Below shows the total assets, liabilities and book value per share for Apple Inc. More…
| Total Assets | Total Liabilities | Book Value Per Share |
| 335.04k | 274.76k | 3.86 |
Key Ratios Snapshot
Some of the financial key ratios for Apple Inc are shown below. More…
| 3Y Rev Growth | 3Y Operating Profit Growth | Operating Margin |
| 11.9% | 18.7% | 30.0% |
| FCF Margin | ROE | ROA |
| 26.3% | 117.6% | 21.5% |
Analysis
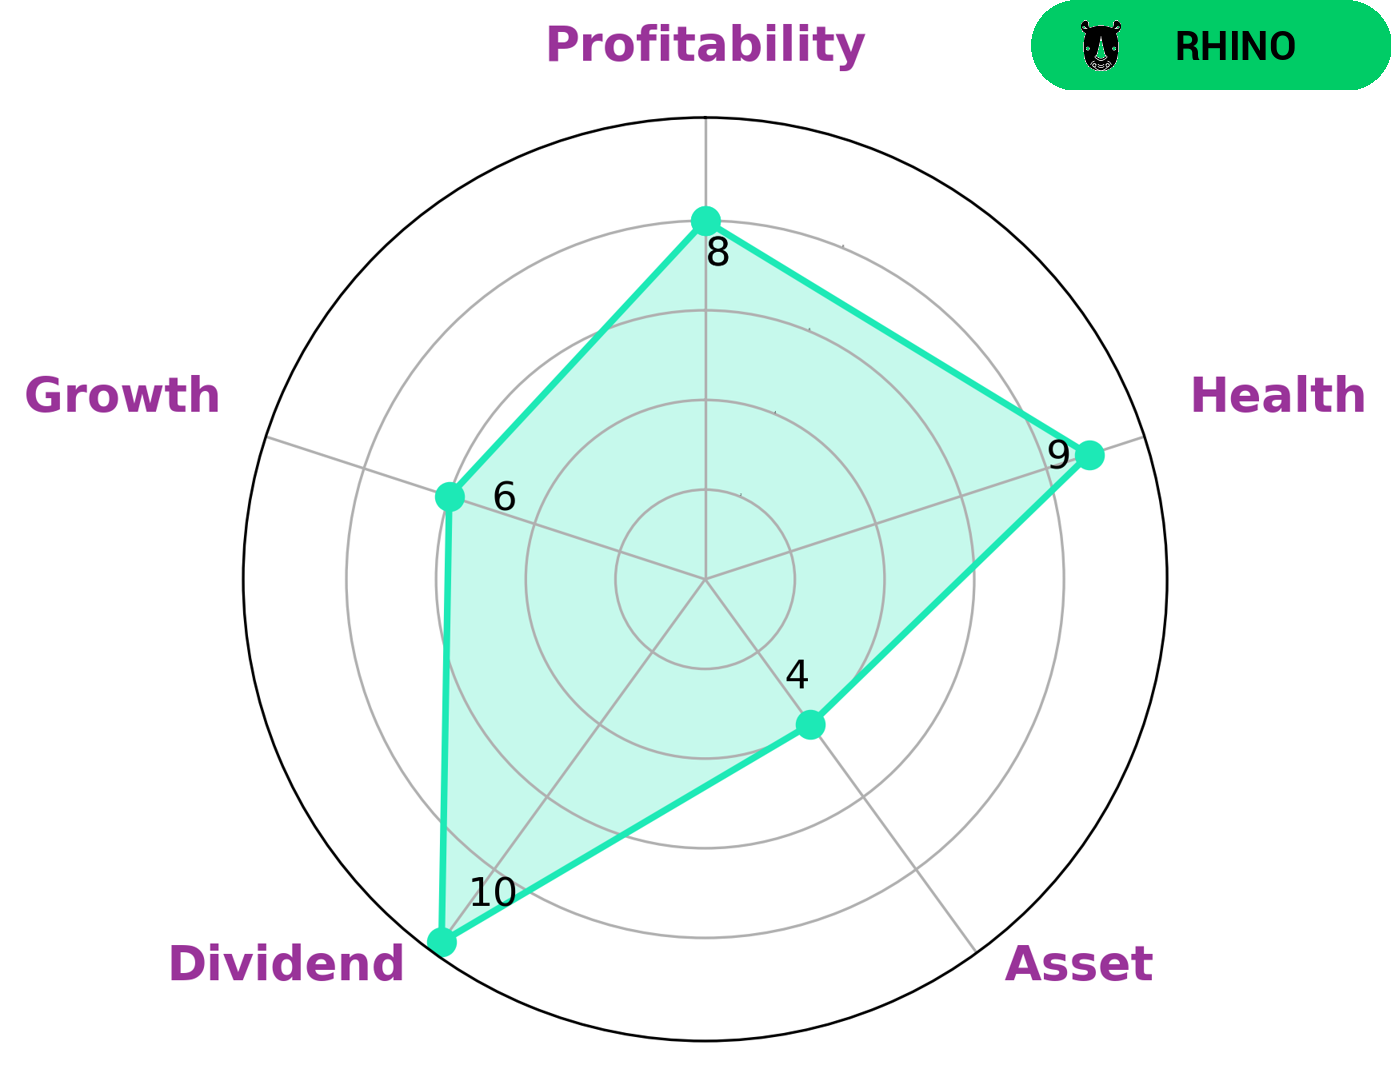
When it comes to evaluating the fundamentals of APPLE INC, GoodWhale’s Star Chart gives the company a high health score of 9/10. This is largely due to its strong cashflows and debt capabilities, which enable it to pay off debt and fund future operations. Furthermore, APPLE INC is strong in dividend and profitability, and medium in asset growth. Based on this analysis, GoodWhale classifies APPLE INC as a ‘rhino’, indicating that it has achieved moderate revenue or earnings growth. Given its strong fundamentals and moderate growth rate, APPLE INC could be an attractive option for investors looking for steady returns. Those looking to invest in companies with higher growth potential may not be interested, however, as APPLE INC is unlikely to offer high returns. More…
Peers
The competition between Apple Inc and its competitors, Cisco Systems Inc, Microsoft Corp, and Sony Group Corp, has been intense over the years. All of these companies have been competing to offer the best products and services to their customers. Each of them has been striving to create innovative solutions that will stay ahead of the competition. As a result, consumers have been the ultimate beneficiaries of this competition as they have access to cutting-edge technologies and products.
– Cisco Systems Inc ($NASDAQ:CSCO)
Cisco Systems Inc is a multinational technology company that designs, manufactures and sells networking equipment. As of 2023, the company has a market capitalization of 199.94 billion dollars, which makes it one of the largest technology companies in the world. Furthermore, its Return on Equity (ROE) stands at 23.05%, which is an indication of its impressive financial performance. Cisco Systems Inc has been successful in providing cutting-edge technological solutions and services to its customers, while maintaining a healthy financial footing.
– Microsoft Corp ($NASDAQ:MSFT)
Microsoft Corporation is a multinational technology company that develops, manufactures, licenses, supports, and sells computer software, consumer electronics, personal computers, and related services. Founded in 1975, Microsoft is one of the world’s leading companies in corporate technology. With a market cap of 1.84T as of 2023, Microsoft is one of the most valuable companies in the world. Microsoft’s Return on Equity (ROE) of 29.64% is also one of the highest rates in the corporate sector. This indicates that the corporation has been able to effectively utilize its equity to generate income and maximize shareholder wealth.
– Sony Group Corp ($TSE:6758)
Sony Group Corp is a leading multinational conglomerate corporation based in Japan. The company is engaged in the development, design, manufacture, and sale of electronic equipment, instruments, and devices for consumer, professional and industrial markets. As of 2023, Sony Group Corp has a market cap of 14.3T, making it one of the largest companies in the world. Additionally, the company has a Return on Equity (ROE) of 10.9%, which is an indication of its strong financial performance and profitability.
Summary
Apple Inc. reported strong quarterly earnings for the third quarter of FY2023, with total revenue of USD 81.8 billion and net income of USD 19.9 billion. This marked a slight decrease in revenue from the same quarter of the previous year, but a year-over-year increase in net income of 2.3%. The results demonstrate the company’s continuing focus on financial discipline and profitable growth, and should give investors confidence in the company’s fundamentals. Apple Inc. remains an attractive investment option in the tech sector, offering strong returns and competitive dividends.
Related Posts


Recent Posts


