HITACHI Reports Third Quarter FY2023 Earnings Results on February 9, 2023
February 28, 2023

Earnings report
On February 9, 2023, HITACHI ($TSE:6501) reported its earnings results for the third quarter of FY2023, which ended on December 31, 2022. The total revenue for the quarter was JPY 119.7 billion, a decrease of 6.7% compared to the same time last year.
However, net income managed to increase by 7.1%, reaching JPY 2692.0 billion. This increase in net income can be attributed to the company’s focus on cost control and efficiency. Overall, the results show that HITACHI is still performing strongly despite the global financial crisis. The company’s strong performance also highlights the importance of strategic planning and tactical execution in order to maintain profitability. With the impressive financial results, HITACHI is well-positioned to continue to grow in the coming years.
Price History
The results were a cause for celebration, as the stock opened at JP¥6976.0 on Thursday and closed at JP¥7043.0, an increase of 0.4% from its previous closing price of 7018.0. Though the change was modest, it was a sign of growth for the company, which experienced volatility in the previous quarter. These results demonstrate the strength of HITACHI‘s recent investments in technology and innovation, a key factor in the company’s long-term success. Live Quote…
About the Company
Income Snapshot
Below shows the total revenue, net income and net margin for Hitachi. More…
| Total Revenues | Net Income | Net Margin |
| 11.03M | 424.92k | 3.9% |
Cash Flow Snapshot
Below shows the cash from operations, investing and financing for Hitachi. More…
| Operations | Investing | Financing |
| 852.88k | -166.41k | -768.25k |
Balance Sheet Snapshot
Below shows the total assets, liabilities and book value per share for Hitachi. More…
| Total Assets | Total Liabilities | Book Value Per Share |
| 13.28M | 8.11M | 5.12k |
Key Ratios Snapshot
Some of the financial key ratios for Hitachi are shown below. More…
| 3Y Rev Growth | 3Y Operating Profit Growth | Operating Margin |
| 6.8% | 5.5% | 6.8% |
| FCF Margin | ROE | ROA |
| 3.8% | 9.9% | 3.5% |
Analysis
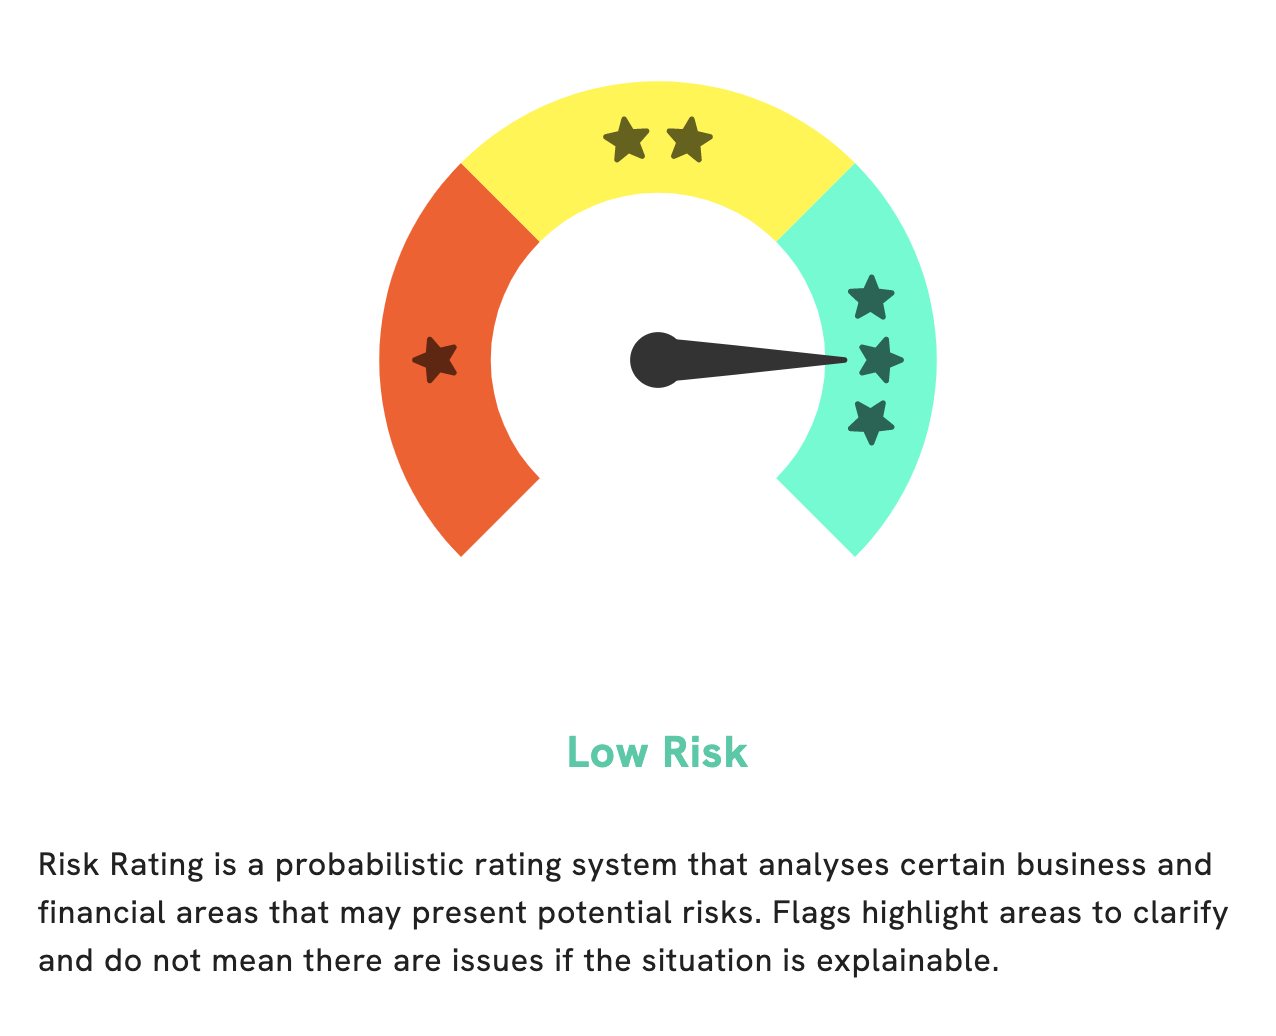
A t G o o d W h a l e , w e r e c e n t l y c o n d u c t e d a n a n a l y s i s o f H I T A C H I ‘ s f u n d a m e n t a l s , a n d t h e R i s k R a t i n g c a m e i n a t a l o w r i s k i n v e s t m e n t i n t e r m s o f f i n a n c i a l a n d b u s i n e s s a s p e c t s . O u r p r o c e s s o f a n a l y s i s i n c l u d e s t h o r o u g h r e s e a r c h o f t h e c o m p a n y ’ s f i n a n c i a l s , c o m p e t i t i v e p o s i t i o n , a n d m a n a g e m e n t t e a m , a n d t h e n w e a s s i g n o u r q u a n t i t a t i v e r a t i n g b a s e d o f f o f t h a t d a t a . A f t e r f u r t h e r i n v e s t i g a t i o n , w e d i d d e t e c t o n e r i s k w a r n i n g i n H I T A C H I ’ s i n c o m e s h e e t , b u t t h i s i s n ’ t c a u s e f o r a l a r m d u e t o t h e o v e r a l l l o w r i s k r a t i n g . I f y o u ’ r e c u r i o u s t o k n o w m o r e a b o u t t h e d e t a i l s , b e c o m e a r e g i s t e r e d u s e r o n o u r s i t e a n d w e ’ l l g i v e y o u a c c e s s t o a l l t h e i n f o r m a t i o n . Y o u c a n r e s t a s s u r e d t h a t y o u ’ l l b e m a k i n g a n i n f o r m e d d e c i s i o n w h e n i t c o m e s t o i n v e s t i n g i n H I T A C H I. More…
Peers
Hitachi Ltd is one of the largest multinational conglomerates in the world. It is a major player in the technology, electronics, and automotive industries, competing against companies such as Digistar Corp Bhd, Kanaden Corp, and ShinMaywa Industries Ltd. These companies bring their own unique set of strengths to the table, presenting a formidable challenge to Hitachi’s dominance in the global market.
– Digistar Corp Bhd ($KLSE:0029)
Digistar Corp Bhd is a Malaysian-based technology and services provider that specializes in digital media, consumer electronics, and communications solutions. With a market cap of 31.25 million as of 2023, the company has seen considerable growth in value over the past few years. In addition, Digistar Corp Bhd has a Return on Equity (ROE) of 13.16%, demonstrating that the company is generating a good return on its investments. This makes Digistar Corp Bhd an attractive option for investors looking for a profitable technology and services provider.
– Kanaden Corp ($TSE:8081)
Kanaden Corp is a multinational corporation based in Japan that provides a wide range of products and services for the automotive, industrial, and electronics industries. In 2023, the company had a market capitalization of 28.66 billion dollars and a return on equity of 5.12%. The company’s market cap is a reflection of its strong financial performance and ability to generate returns for its shareholders. Furthermore, its return on equity indicates that it is able to effectively utilize the capital invested in the company to generate profits.
– ShinMaywa Industries Ltd ($TSE:7224)
ShinMaywa Industries Ltd is a Japanese industrial firm specializing in the production of aircraft, ships, and other transportation-related products. The company has a market cap of 67.87B as of 2023, indicating a strong presence in the market. Its Return on Equity (ROE) of 7.42% illustrates that the company is making efficient use of its shareholders’ funds, allowing it to generate significant profits. The high market cap and ROE of ShinMaywa Industries Ltd are a testament to its success in the industry.
Summary
Hitachi reported total revenue of JPY 119.7 billion for the quarter, which was a 6.7% decrease from the same time last year. Despite the decrease in total revenue, net income experienced a 7.1% increase, bringing the total to JPY 2692.0 billion. This suggests that despite a decrease in turnover, Hitachi has remained a profitable investing option as it was able to capitalize on its cost-effective strategies. Hitachi shows promise for investors given its competitive performance amidst challenging market conditions and will likely continue to be an attractive option in the near future.
Related Posts


Recent Posts


