Cricut Inc Stock Fair Value Calculator – CRICUT INC Reports Record Earnings for Q2 FY2023
October 21, 2023

🌥️Earnings Overview
On August 8, 2023, Cricut Inc ($NASDAQ:CRCT). reported its second quarter financial results for FY2023, ending June 30, 2023. Total revenue for the period totaled USD 177.8 million, a decrease of 3.3% compared to the same quarter of the previous year. Net income for the quarter increased by 15.8% year-over-year, reaching USD 16.0 million.
Market Price
On Tuesday, CRICUT INC reported record earnings for the second quarter of fiscal year 2023. The company’s stock opened at $9.8 and closed at $10.1, down by 0.1% from its prior closing price of 10.1. Despite the slight downturn, investors were pleased with the performance as the earnings report showed a significant increase year-over-year. CRICUT INC attributed the rise in profits to a strong demand in North America, Europe and Asia for its cutting and crafting products.
The company also highlighted its new product launches, which helped drive sales and increase its customer base. Despite the strong performance, CRICUT INC cautioned investors that there could be some headwinds in the coming months as the global economic situation continues to be uncertain. The company also noted that it will continue to invest in R&D and product development in order to stay competitive and remain ahead of the curve. Live Quote…
About the Company
Income Snapshot
Below shows the total revenue, net income and net margin for Cricut Inc. More…
| Total Revenues | Net Income | Net Margin |
| 816.75 | 48.46 | 5.9% |
Cash Flow Snapshot
Below shows the cash from operations, investing and financing for Cricut Inc. More…
| Operations | Investing | Financing |
| 264.29 | -19.12 | -106.83 |
Balance Sheet Snapshot
Below shows the total assets, liabilities and book value per share for Cricut Inc. More…
| Total Assets | Total Liabilities | Book Value Per Share |
| 898.34 | 416.03 | 2.2 |
Key Ratios Snapshot
Some of the financial key ratios for Cricut Inc are shown below. More…
| 3Y Rev Growth | 3Y Operating Profit Growth | Operating Margin |
| 22.1% | 14.3% | 7.1% |
| FCF Margin | ROE | ROA |
| 28.8% | 6.2% | 4.1% |
Analysis – Cricut Inc Stock Fair Value Calculator
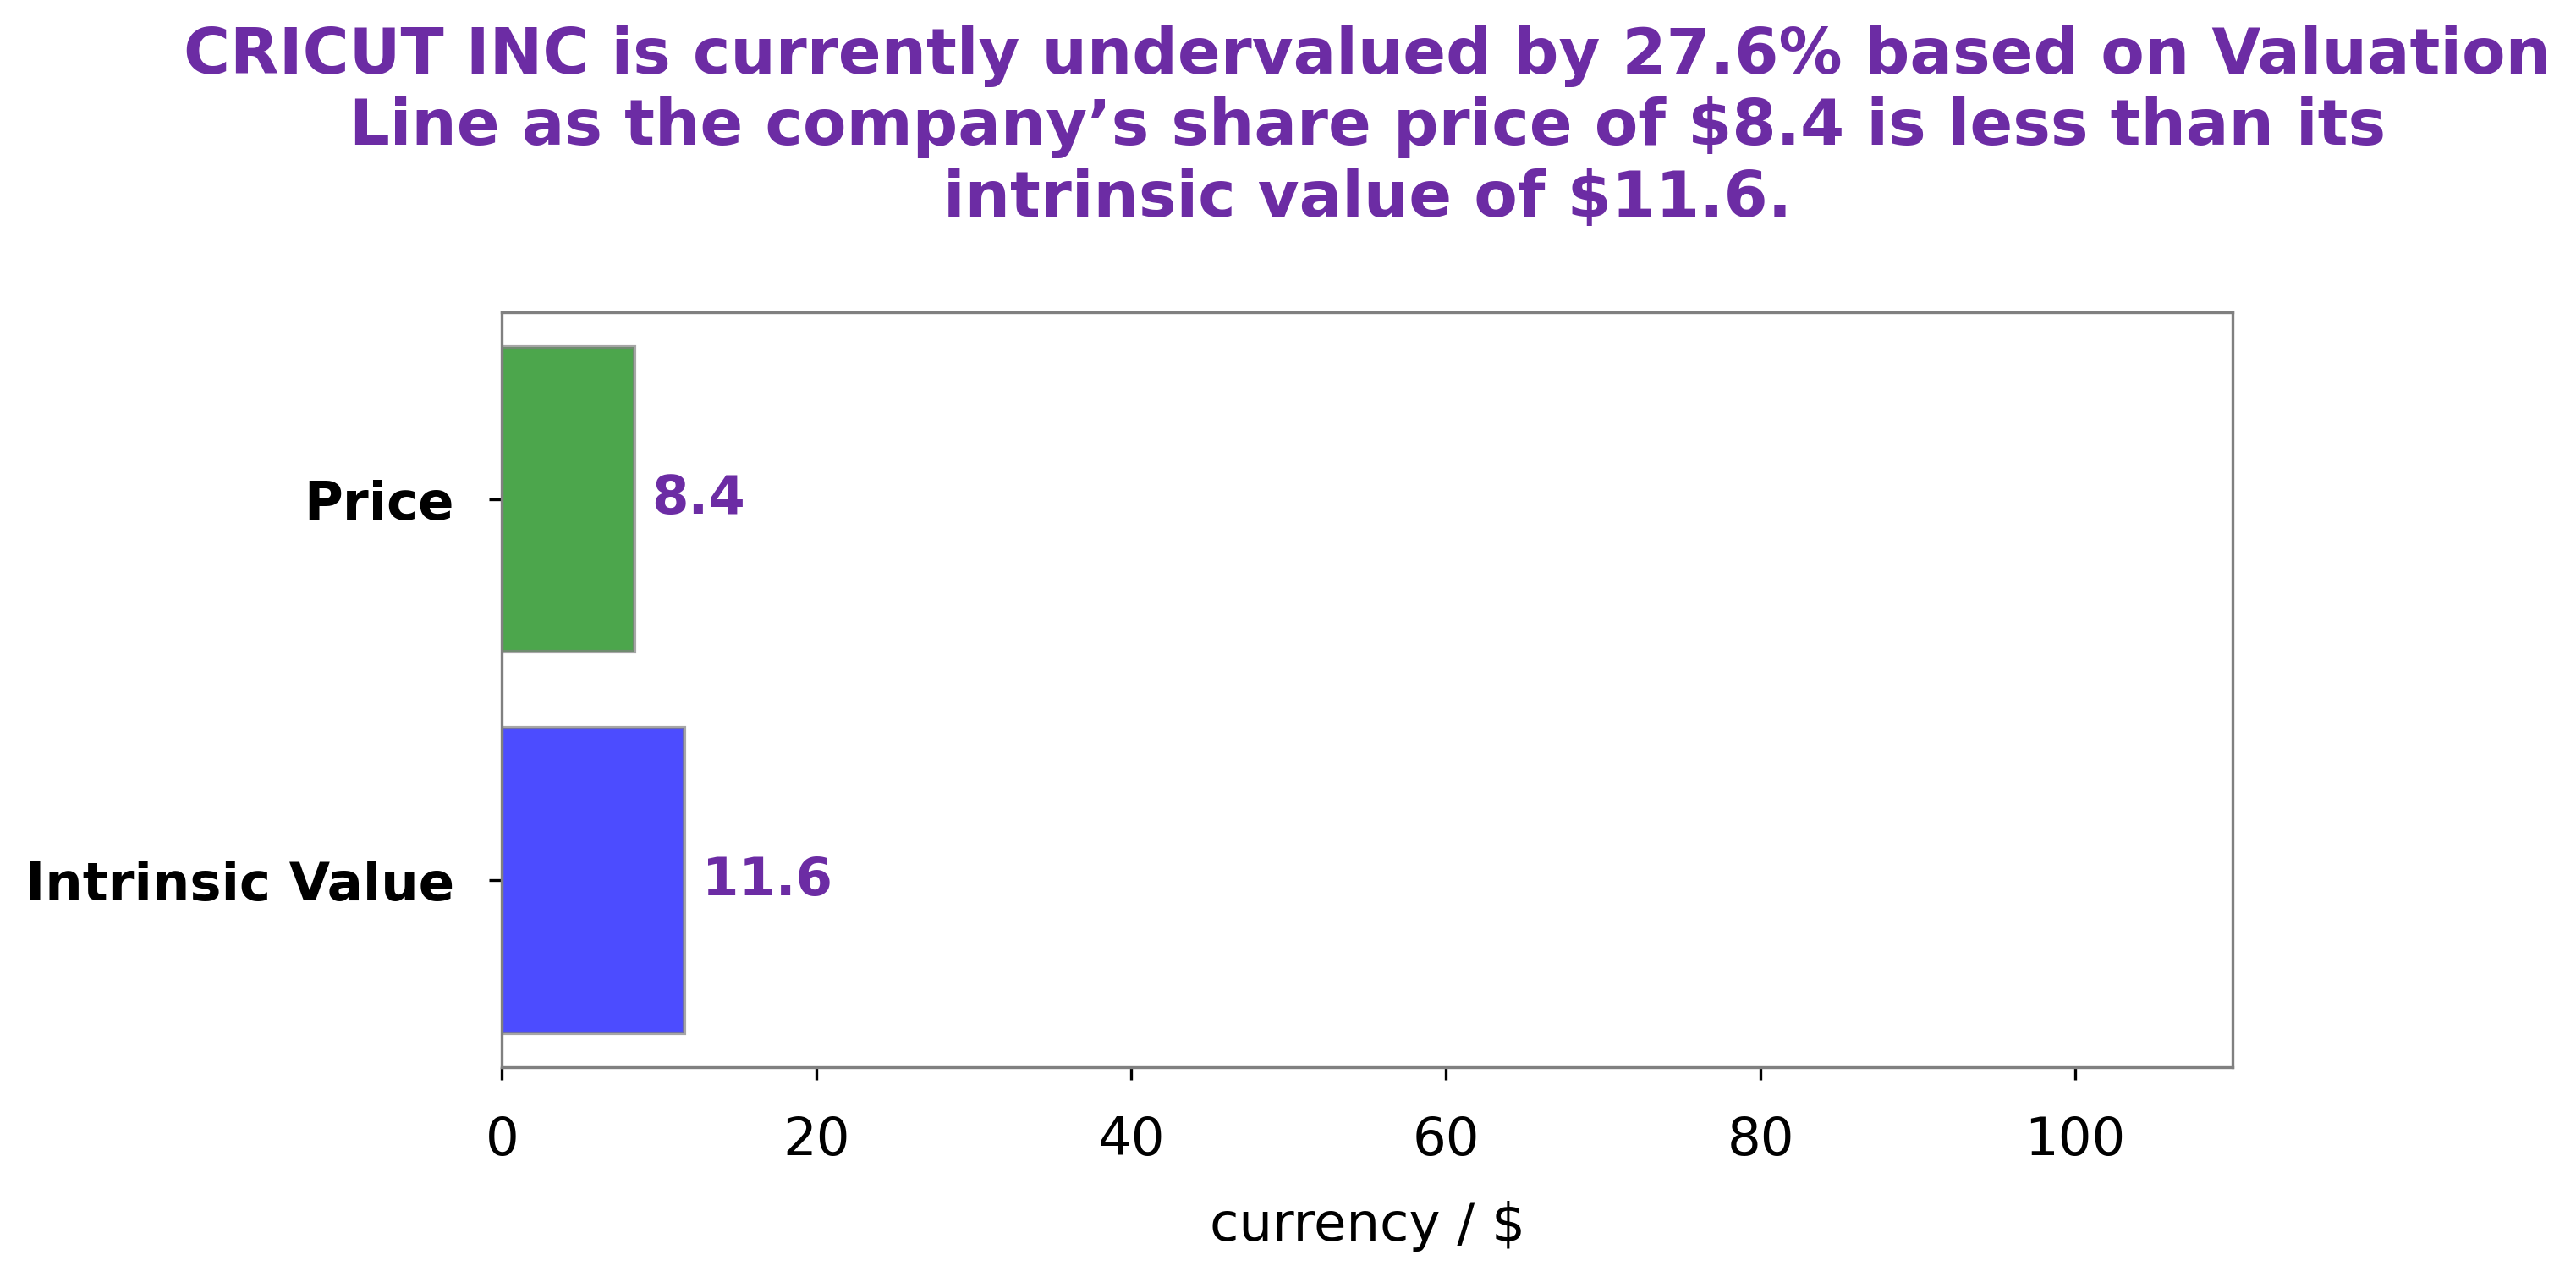
We at GoodWhale have conducted a comprehensive analysis of CRICUT INC‘s wellbeing. Our proprietary Valuation Line tool has computed the intrinsic value of CRICUT INC’s share to be around $10.8. Currently, CRICUT INC stock is being traded at a price of $10.1 – implying that it is undervalued by 6.8%. This is a fair price for investors to buy in to from our perspective. More…
Peers
They are one of the top competitors in the market, with Shenzhen FRD Science & Technology Co Ltd, Arisawa Mfg Co Ltd, and Advance Materials Corp also vying for market share. Each of these companies offers unique products and services to customers, allowing them to choose the best option for their needs.
– Shenzhen FRD Science & Techonology Co Ltd ($SZSE:300602)
Shenzhen FRD Science & Techonology Co Ltd is a Chinese technology company that specializes in providing software, hardware, and systems engineering services. The company has a market capitalization of 8.41 billion dollars as of 2023 and boasts a Return on Equity (ROE) of -2.24%. The market cap and ROE of Shenzhen FRD Science & Techonology Co Ltd indicate that the company is well-positioned for growth and profitability. Despite the relatively low ROE, Shenzhen FRD Science & Techonology Co Ltd has managed to generate significant revenue and profits for its shareholders. As the company continues to focus on innovation and developing new products, its market cap and ROE are expected to continue to increase in the coming years.
– Arisawa Mfg Co Ltd ($TSE:5208)
Arisawa Mfg Co Ltd is a Japanese company that manufactures and distributes engineering products and machined components. The company has a market capitalization of 45.62B as of 2023 and a Return on Equity of 6.74%. This suggests that the company is in a healthy financial position and is able to generate positive returns on its equity investments. The company has a strong presence in the Japanese market, but has extended its reach to other countries as well. Arisawa Mfg Co is well positioned to capitalize on the global engineering industry’s growth.
– Advance Materials Corp ($TPEX:3585)
Advance Materials Corp is a large international producer of high-performance ceramic materials, composites, and metal-matrix composites. As of 2023, the company has a market cap of 900.12M. The Return on Equity (ROE) for Advance Materials Corp is -7.65%, which is below the industry average, indicating that the company has been unable to generate an adequate return for its investors. The company is likely trying to improve its ROE through cost cutting and increasing efficiency, as well as focusing on higher margin products.
Summary
CRICUT INC reported its second-quarter earnings for FY2023, showing total revenue of USD 177.8 million, a decrease of 3.3% compared to the same quarter in the prior year. Net income rose 15.8% year over year to USD 16.0 million, indicating a strong performance in the quarter. For investors, this could be seen as a positive sign that the company is returning to growth. However, investors may want to consider factors such as future revenue and earnings growth potential, as well as any potential risks, before investing in CRICUT INC.


