Harmonic Reports Non-GAAP EPS of $0.12, Revenue of $157.6M Misses Expectations by $0.26M
May 10, 2023

Trending News ☀️
While the Non-GAAP EPS was above expectations by $0.03, the revenue figure fell short of the consensus estimate by $0.26M. Harmonic Inc ($NASDAQ:HLIT). is an American multinational telecommunications equipment company based in San Jose, California. It provides a wide range of video delivery solutions and services, including IPTV, OTT, and multiscreen video delivery, as well as digital TV gateways, encoders, transcoders, headend systems, edgeQAMs and signal processing systems. The company serves customers ranging from cable operators to broadcasters, content owners and distributors to government agencies, educational institutions and research laboratories.
Earnings
HARMONIC INC has released its earning report for FY2022 Q4 ending December 31 2022, showing total revenue of $164.33M USD and net income of $6.13M USD. Compared to the same period last year, total revenue increased by 5.5% while net income decreased by 69.1%. Over the past three years, HARMONIC INC’s total revenue has grown from $131.53M USD to $164.33M USD.
About the Company
Income Snapshot
Below shows the total revenue, net income and net margin for Harmonic Inc. More…
| Total Revenues | Net Income | Net Margin |
| 624.96 | 28.18 | 4.8% |
Cash Flow Snapshot
Below shows the cash from operations, investing and financing for Harmonic Inc. More…
| Operations | Investing | Financing |
| 5.48 | -1.29 | -43.13 |
Balance Sheet Snapshot
Below shows the total assets, liabilities and book value per share for Harmonic Inc. More…
| Total Assets | Total Liabilities | Book Value Per Share |
| 710.02 | 385.51 | 2.95 |
Key Ratios Snapshot
Some of the financial key ratios for Harmonic Inc are shown below. More…
| 3Y Rev Growth | 3Y Operating Profit Growth | Operating Margin |
| 15.8% | 44.4% | 7.9% |
| FCF Margin | ROE | ROA |
| -0.6% | 9.9% | 4.4% |
Market Price
HARMONIC INC, a technology company, reported on Monday that its non-GAAP earnings per share (EPS) were $0.12 and its revenue was $157.6 million in the most recent quarter. This was slightly below analysts’ expectations of $0.26 million. Nevertheless, the company’s stock opened and closed at $13.5, representing a 0.1% increase from the previous day’s closing price of $13.5.
Overall, the company’s performance was still satisfactory given the current economic climate and investors appeared to be largely encouraged by its results. Going forward, HARMONIC INC will likely focus on further increasing its revenue and profitability in order to keep shareholders satisfied. Live Quote…
Analysis
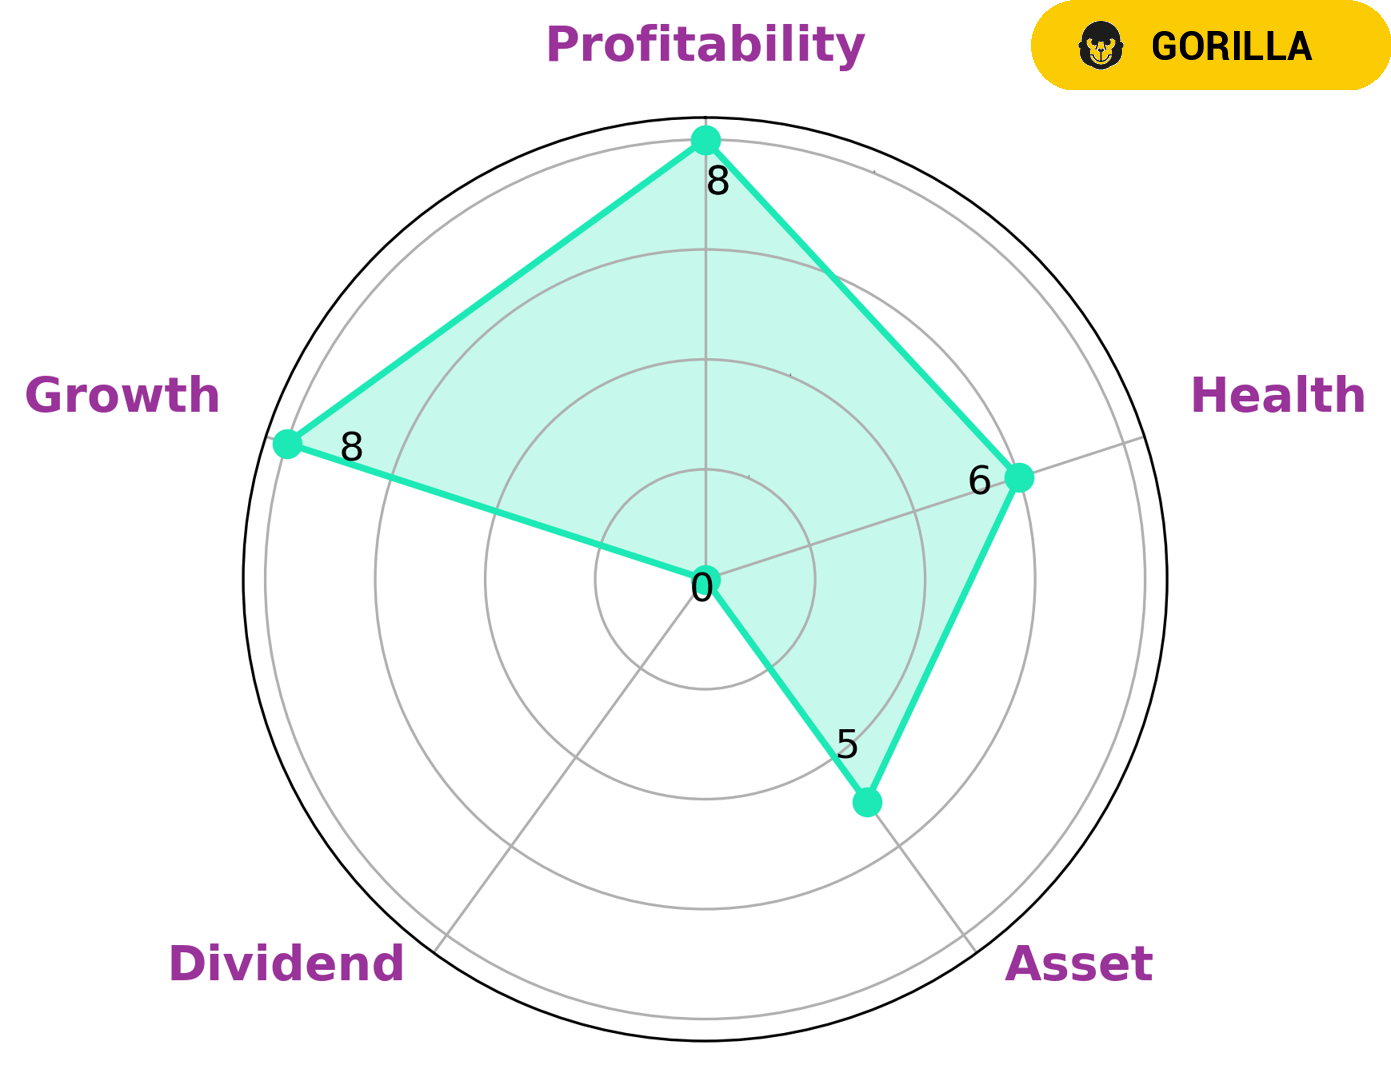
GoodWhale’s analysis of HARMONIC INC’s financials shows that it is likely to sustain future operations in times of crisis, based on its Star Chart score of 6/10. This score comes from assessing the company’s cashflows and debt, so HARMONIC INC is judged to have intermediate health. Additionally, our star analysis reveals that HARMONIC INC is strong in growth and profitability, medium in asset, and weak in dividend. Based on these findings, we have classified HARMONIC INC as a ‘gorilla’, which is a type of company that has a stable and high revenue or earning growth due to its strong competitive advantage. Given HARMONIC INC’s impressive growth and profitability, investors that are looking for sustained and reliable returns would be interested in investing in the company. Long-term investors who are looking for capital appreciation can also benefit from these metrics as they suggest that HARMONIC INC is a safe investment with a potential for higher returns. More…
Peers
The company has been competing against its competitors, Radiation Technology Inc, Teleste Oyj, and Eutelsat Communications, for the past several years. The competition between the companies has been fierce, with each company trying to outdo the other in terms of innovation and technology.
– Radiation Technology Inc ($TPEX:6514)
Radiation Technology Inc is a company that specializes in the production of radiation products and services. The company has a market capitalization of 1.45 billion as of 2022 and a return on equity of 13.65%. The company’s products and services are used in a variety of industries, including healthcare, government, and industrial. Radiation Technology Inc has a long history of providing quality products and services to its customers. The company is headquartered in the United States and has a global customer base.
– Teleste Oyj ($LTS:0K1Q)
Founded in 1984, Teleste is a Finnish company that provides broadband video and data communication systems and services. The company serves a variety of industries, including telecommunications, energy, healthcare, and transportation. Teleste has a market capitalization of 61.06 million euros as of 2022 and a return on equity of 3.58%. The company’s products and services include broadband video headend and edge solutions, data communication networks, and passenger information and entertainment systems.
– Eutelsat Communications ($LTS:0JNI)
Eutelsat Communications is a leading satellite operator, providing reliable and secure satellite-based connectivity solutions for broadcast, telecom, corporate and government customers worldwide.
Eutelsat Communications has a market capitalization of 2.16 billion as of 2022 and a return on equity of 9.77%. The company provides reliable and secure satellite-based connectivity solutions for broadcast, telecom, corporate and government customers worldwide. Eutelsat Communications is headquartered in Paris, France.
Summary
Harmonic Inc, a Nasdaq-listed company, recently reported its quarterly earnings results. Non-GAAP EPS was $0.12, beating analyst estimates by $0.03. Investors will take into account the company’s revenue miss in deciding whether to invest in the company’s stock. Analysts will likely be assessing the company’s ability to maintain strong Non-GAAP EPS and meet revenue expectations in the future.


