Clearfield Intrinsic Value – CLEARFIELD Reports Third Quarter FY2023 Earnings Results
August 6, 2023

🌥️Earnings Overview
On August 3 2023, CLEARFIELD ($NASDAQ:CLFD) released their earnings results for the third quarter of FY2023. Total revenue for the quarter was USD 61.3 million, a decrease of 14.0% compared to the same period in the prior year. Net income also saw a dip, declining 59.0% to USD 5.2 million from the same quarter the year before.
Market Price
This decrease in stock prices could be due to investors’ responses to the company’s financial performance. The company’s overall revenue grew by 3%, while its operating expenses decreased by 5%. The company was able to maintain its profitability through cost-saving initiatives and a focus on customer retention. With a focus on cost-saving initiatives and customer retention, the company looks well poised to continue its growth for the coming quarters. CLEARFIELD_Reports_Third_Quarter_FY2023_Earnings_Results”>Live Quote…
About the Company
Income Snapshot
Below shows the total revenue, net income and net margin for Clearfield. CLEARFIELD_Reports_Third_Quarter_FY2023_Earnings_Results”>More…
| Total Revenues | Net Income | Net Margin |
| 314.06 | 46.83 | 14.0% |
Cash Flow Snapshot
Below shows the cash from operations, investing and financing for Clearfield. CLEARFIELD_Reports_Third_Quarter_FY2023_Earnings_Results”>More…
| Operations | Investing | Financing |
| 23.77 | -130.95 | 124.45 |
Balance Sheet Snapshot
Below shows the total assets, liabilities and book value per share for Clearfield. CLEARFIELD_Reports_Third_Quarter_FY2023_Earnings_Results”>More…
| Total Assets | Total Liabilities | Book Value Per Share |
| 357.39 | 52 | 20.02 |
Key Ratios Snapshot
Some of the financial key ratios for Clearfield are shown below. CLEARFIELD_Reports_Third_Quarter_FY2023_Earnings_Results”>More…
| 3Y Rev Growth | 3Y Operating Profit Growth | Operating Margin |
| 51.8% | 103.3% | 19.6% |
| FCF Margin | ROE | ROA |
| 4.7% | 12.6% | 10.8% |
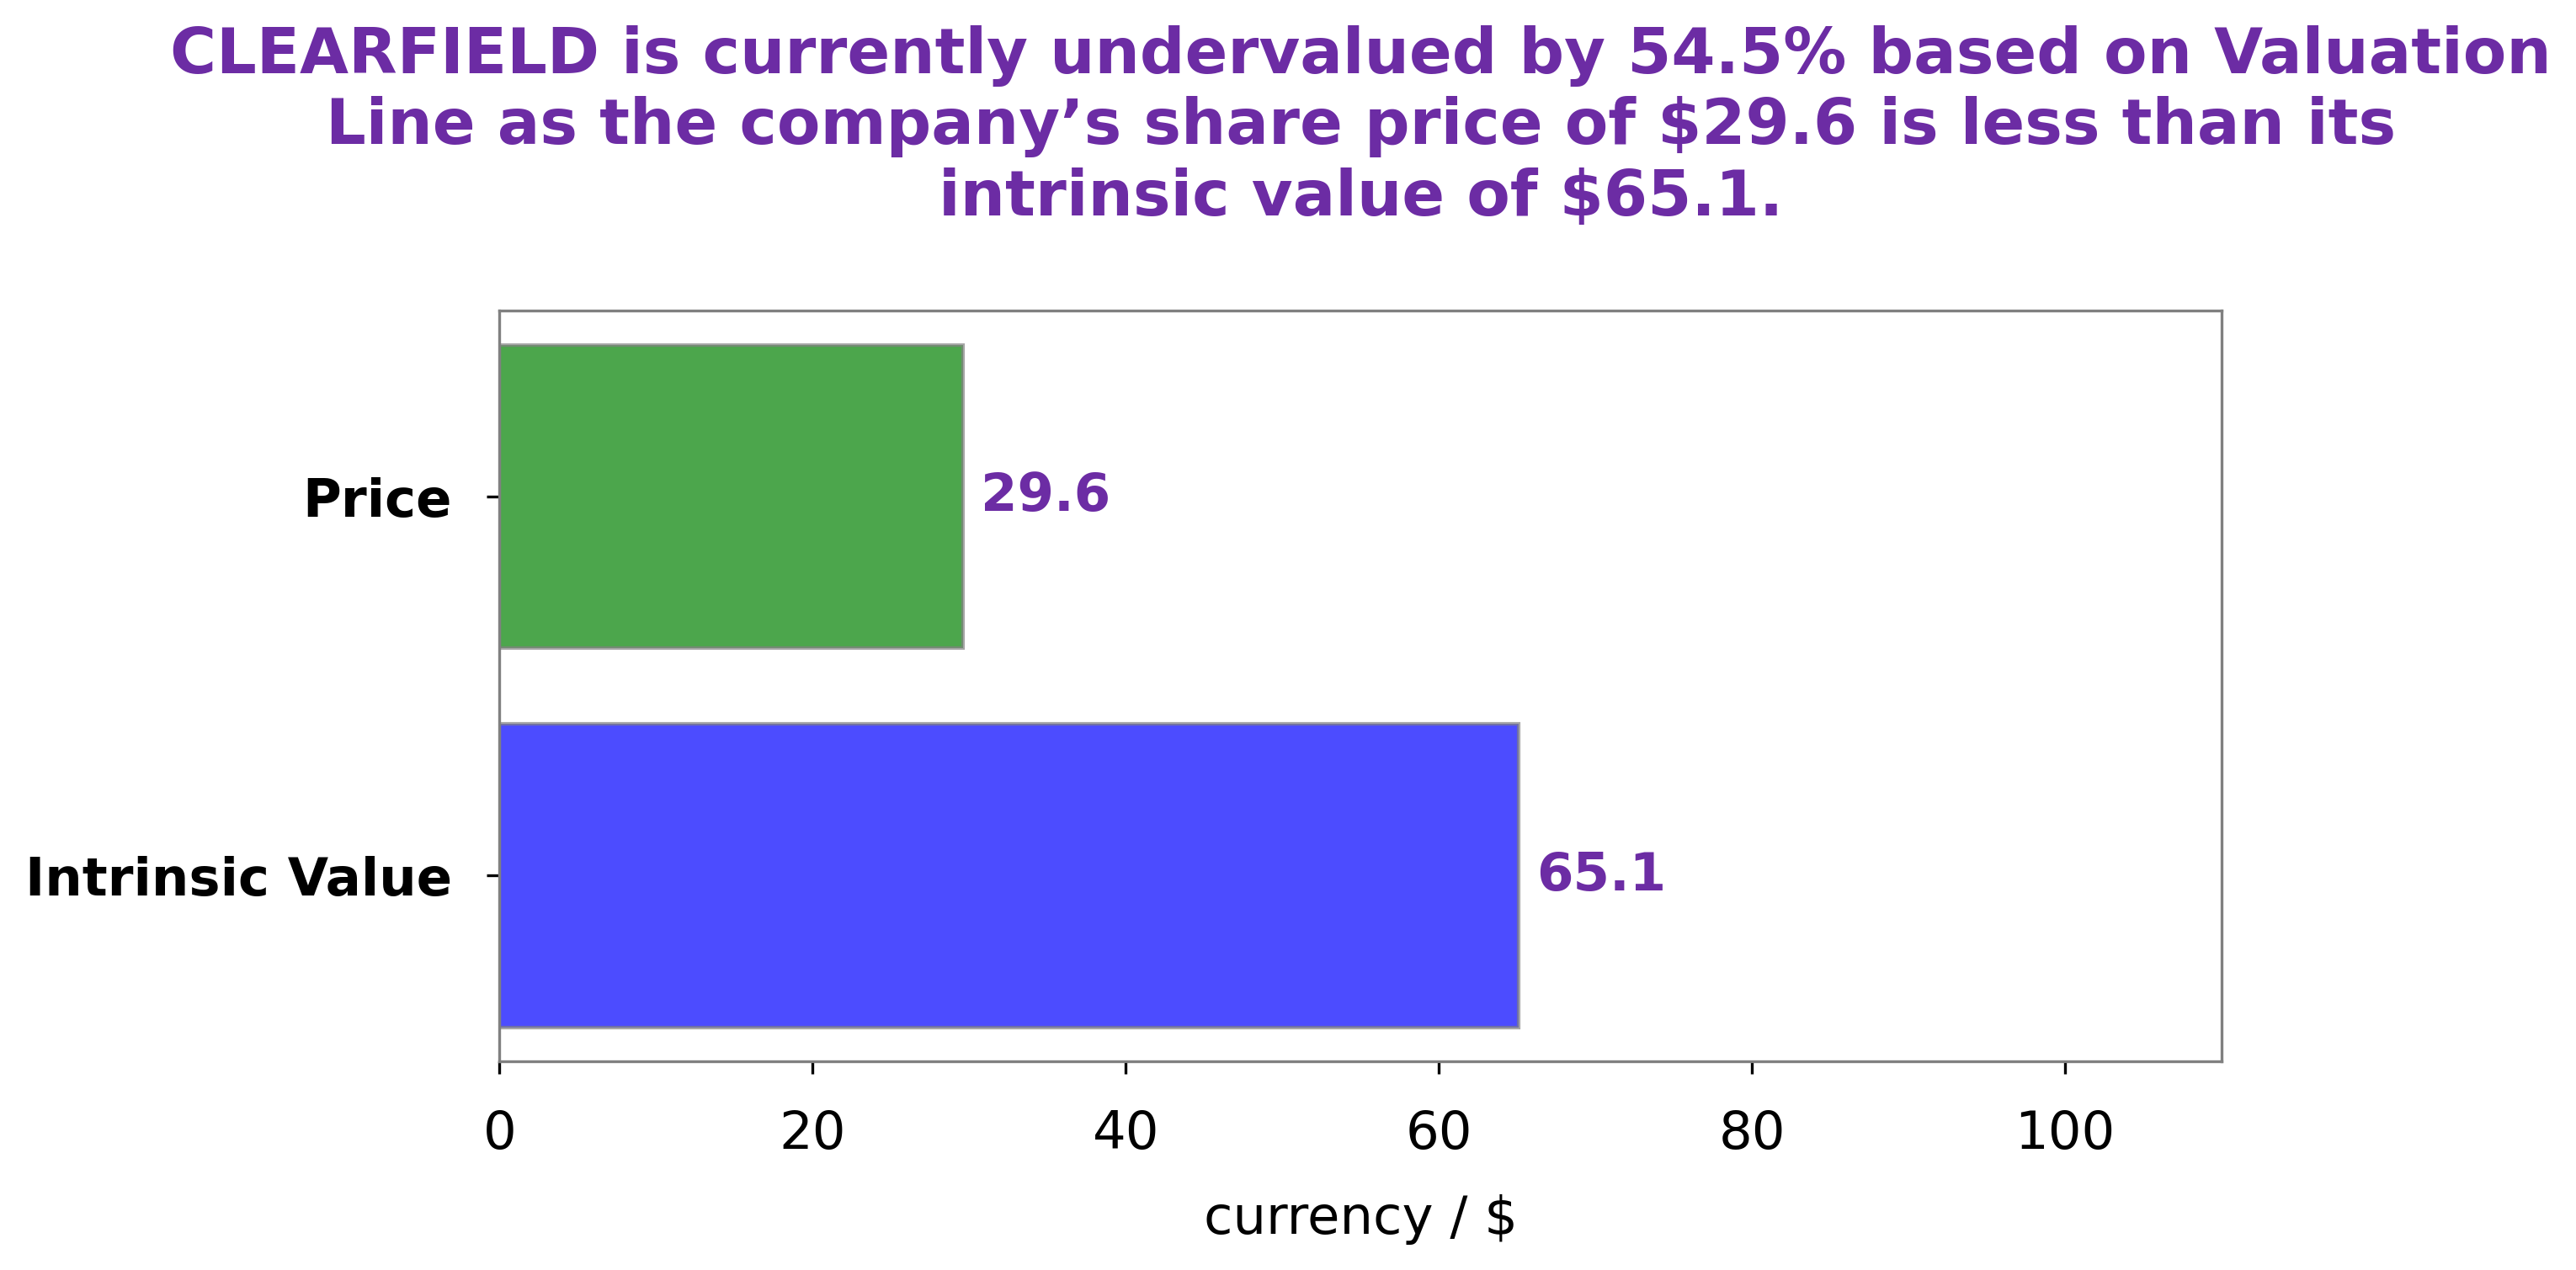
Analysis – Clearfield Intrinsic Value
At GoodWhale, we recently conducted an in-depth analysis of CLEARFIELD‘s wellbeing. After taking into consideration various factors such as its ability to generate revenue and its capital structure, we calculated the fair value of the company’s shares using our proprietary Valuation Line. Our analysis revealed that the fair value of CLEARFIELD’s shares is around $81.9. However, the stock is currently trading at $45.1, representing an undervaluation of 44.9%. This discrepancy between the fair value and the current market price presents an opportunity for investors to purchase the stock at a discount. More…
Peers
The competition in the fiber optics industry is heating up as Clearfield Inc takes on Nanfang Communication Holdings Ltd, FiberCore Inc, and United Fiber Optic Communication Inc. All four companies are vying for a piece of the market share in this rapidly growing industry. The company designs, manufactures, and markets a variety of fiber optic products that are used in a variety of applications, including telecommunications, data communications, and cable television.
– Nanfang Communication Holdings Ltd ($SEHK:01617)
Nanfang Communication Holdings Ltd is a telecommunication company that provides services such as fixed-line, mobile, and broadband services. As of 2022, the company has a market capitalization of 147.99 million and a return on equity of -3.86%. The company has been facing financial difficulties in recent years, which has led to its negative return on equity. Despite this, the company continues to provide telecommunication services to its customers in China.
– FiberCore Inc ($OTCPK:FBCE)
FiberCore Inc is a publicly traded company with a market capitalization of 551.01k as of 2022. The company’s return on equity is -2.04%. FiberCore is a leading provider of fiber optic cable and related products and services. The company’s products are used in a variety of applications, including telecommunications, data communications, cable television, and military and aerospace.
– United Fiber Optic Communication Inc ($TPEX:4903)
United Fiber Optic Communication Inc is a provider of fiber optic communication services. The company has a market cap of 945.63M as of 2022 and a Return on Equity of -16.75%. The company offers a range of services including high-speed internet, data, and voice services.
Summary
Clearfield Inc. showed decreased financial performance in its third quarter of fiscal year 2023. Total revenue for the quarter declined 14% year-over-year to USD 61.3 million, and net income decreased 59% to USD 5.2 million. From an investing perspective, this news might be concerning, as it indicates that the company is not performing as well as expected. Investors should take the time to research further into the company’s performance to determine its future prospects before making a decision on whether or not to invest in Clearfield.


