LSB Industries Reports In-Line Non-GAAP EPS and Beats Revenue Expectations
May 4, 2023

Trending News 🌥️
LSB ($NYSE:LXU) Industries, Inc. is a manufacturer of chemical products for the industrial and agricultural markets. The company recently reported their non-GAAP earnings per share (EPS) of $0.25, which was in line with market expectations.
Additionally, their total revenue was reported as $181M, beating estimates by $2.41M. The company’s performance highlights the strength of their market position and growth potential. Their revenue stream was bolstered by strong demand for their chemical products, and the company is optimistic about their future prospects given their strategies to increase production capacity and gain market share. Overall, the results of LSB Industries are encouraging and suggest that they have the potential to have a positive impact on the market in the long run. Investors should pay close attention to the company as they look to capitalize on their strong fundamentals in the near future.
Earnings
LSB Industries, Inc. reported their latest earnings as of December 31 2022 for FY2022 Q4 and the results were in-line with non-GAAP earnings per share (EPS) expectations. Compared to the prior year, total revenue increased 22.8% and net income increased 56.5%. In the last three years, LSB Industries has seen an increase in total revenue from 88.9M USD to 233.65M USD. This is an impressive feat, showing the company’s ability to keep expanding despite a difficult economic climate.
About the Company
Income Snapshot
Below shows the total revenue, net income and net margin for Lsb Industries. More…
| Total Revenues | Net Income | Net Margin |
| 901.71 | 230.35 | 25.6% |
Cash Flow Snapshot
Below shows the cash from operations, investing and financing for Lsb Industries. More…
| Operations | Investing | Financing |
| 345.65 | -369.74 | 5.71 |
Balance Sheet Snapshot
Below shows the total assets, liabilities and book value per share for Lsb Industries. More…
| Total Assets | Total Liabilities | Book Value Per Share |
| 1.44k | 923.95 | 6.76 |
Key Ratios Snapshot
Some of the financial key ratios for Lsb Industries are shown below. More…
| 3Y Rev Growth | 3Y Operating Profit Growth | Operating Margin |
| 35.2% | -28.7% | 35.1% |
| FCF Margin | ROE | ROA |
| 33.3% | 37.9% | 13.7% |
Share Price
On Tuesday, LSB INDUSTRIES released their non-GAAP earnings per share (EPS) and revenue results, both of which were in line with the consensus analyst estimates. Although the company’s stock opened at $8.8 and closed at $8.8, this was still 1.3% lower than its previous closing price of 8.9. Surprisingly, the company reported higher-than-expected revenue, which was a positive sign for investors. The company noted an increase in demand for its products, which helped drive the higher-than-expected revenue.
This positive news was also reflected in the company’s strong financial position as its balance sheet remains healthy, with adequate liquidity and a low debt-to-equity ratio. Overall, investors appear to be relatively pleased with LSB INDUSTRIES’ non-GAAP EPS and revenue results and are looking forward to its continued success in the future. Live Quote…
Analysis
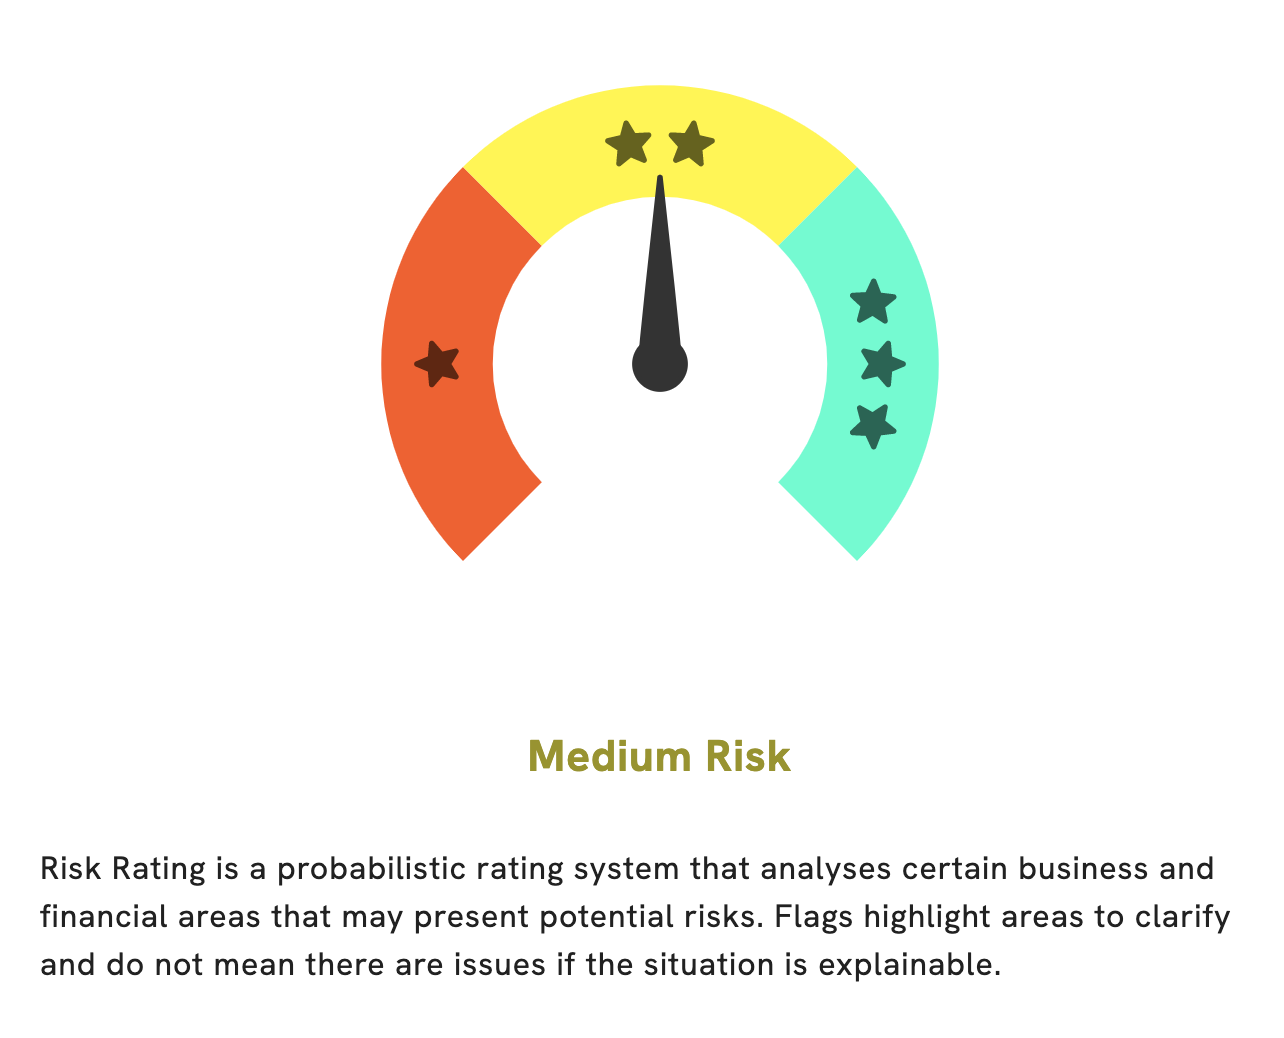
At GoodWhale, we recently conducted an in-depth analysis of LSB INDUSTRIES‘ wellbeing. Our findings show that it is a medium risk investment in terms of financial and business aspects. We identified one risk warning in the company’s income sheet. If you are interested in learning more about this risk warning, be sure to sign up with us and check it out. With our analysis, we can help you gain a better understanding of the risks associated with investing in LSB INDUSTRIES so that you can make an educated decision when considering it as a potential investment. More…
Peers
LSB Industries Inc, a chemical manufacturing company, produces and sells chemicals, including ammonia, urea ammonium nitrate, and methanol. The company’s competitors include Westlake Chemical Partners LP, Univar Solutions Inc, and AdvanSix Inc.
– Westlake Chemical Partners LP ($NYSE:WLKP)
Westlake Chemical Partners LP is a publicly traded limited partnership formed in 2014 by Westlake Chemical Corporation. The Partnership is engaged in the business of owning, operating and developing ethylene production facilities and related assets. Westlake Chemical Partners’ ethylene production facilities are located in Lake Charles, Louisiana and Longview, Texas. The Partnership’s common units trade on the New York Stock Exchange under the symbol “WLKP”.
– Univar Solutions Inc ($NYSE:UNVR)
Univar Solutions Inc is a global chemical and ingredient distributor and provider of value-added services. The company has a market cap of 4.25B as of 2022 and a Return on Equity of 21.66%. Univar Solutions Inc operates in more than 40 countries and provides products and services to customers in a variety of industries, including chemicals, pharmaceuticals, food and beverage, agriculture, construction, and personal care. The company offers a broad portfolio of products and services, including sourcing, logistics, distribution, formulation, and technical services.
– AdvanSix Inc ($NYSE:ASIX)
AdvanSix Inc is a specialty chemical company that produces and sells resins, chemicals, and intermediates. The company has a market cap of 1.02B as of 2022 and a Return on Equity of 23.64%. The company’s products are used in a variety of applications, including adhesives, coatings, insulation, and tires.
Summary
LSB Industries Inc. recently released its non-GAAP earnings per share (EPS) of $0.25, which is in-line with analysts’ expectations. Revenue was reported at $181 million, beating consensus estimates by $2.41 million. The company’s financial performance demonstrates its ability to continue generating attractive returns for investors. Investor sentiment towards the stock has been positive, leading to a significant uptick in the share price.
Despite this strong performance, the company still faces several risks in the coming quarters, including a weak economy, geopolitical uncertainty, and changing customer demands. Investors should monitor the company’s performance closely and monitor any potential new developments that could affect their decision to invest.


