JANUS INTERNATIONAL Reports Strong Earnings for Second Quarter of FY 2023
August 23, 2023

☀️Earnings Overview
JANUS INTERNATIONAL ($NYSE:JBI) reported total revenue of USD 270.6 million for the second quarter of fiscal year 2023, a 9.2% rise from the same quarter in the prior year. Net income grew 62.0% to USD 37.0 million, when compared to the same period in the previous fiscal year. The results were reported on June 30 2023.
Price History
On Thursday, JANUS INTERNATIONAL reported a strong second quarter earnings report for fiscal year 2023. The company’s stock opened at $11.7 and closed at $11.5, a rise of 6.8% from the prior closing price of $10.8. This impressive growth reaffirms the company’s commitment to providing the highest quality products and services to its customers. The success of JANUS INTERNATIONAL is largely attributed to its innovation in the industry as well as its focus on customer satisfaction. The company has consistently invested in research and development, ensuring that their products are up to date with the latest technology.
Additionally, JANUS INTERNATIONAL has developed an extensive customer service network, which allows for efficient and timely responses to customer inquiries. JANUS INTERNATIONAL has also made great strides in the area of environmental sustainability. The company has implemented several green initiatives in order to reduce their carbon footprint and improve their efficiency. Furthermore, they have made significant investments in renewable energy sources, such as solar and wind power, which will help them to reduce their reliance on traditional sources of power. Overall, the strong performance of JANUS INTERNATIONAL this quarter is indicative of their long-term commitment to providing quality products and services, while also ensuring that they remain environmentally conscious. With their impressive earnings report and dedication to sustainability, JANUS INTERNATIONAL is poised for continued success in the years ahead. Live Quote…
About the Company
Income Snapshot
Below shows the total revenue, net income and net margin for Janus International. More…
| Total Revenues | Net Income | Net Margin |
| 1.06k | 128.08 | 12.0% |
Cash Flow Snapshot
Below shows the cash from operations, investing and financing for Janus International. More…
| Operations | Investing | Financing |
| 141.91 | -14.06 | -58.48 |
Balance Sheet Snapshot
Below shows the total assets, liabilities and book value per share for Janus International. More…
| Total Assets | Total Liabilities | Book Value Per Share |
| 1.29k | 845.15 | 3.02 |
Key Ratios Snapshot
Some of the financial key ratios for Janus International are shown below. More…
| 3Y Rev Growth | 3Y Operating Profit Growth | Operating Margin |
| – | – | 21.4% |
| FCF Margin | ROE | ROA |
| 12.1% | 33.6% | 11.1% |
Analysis
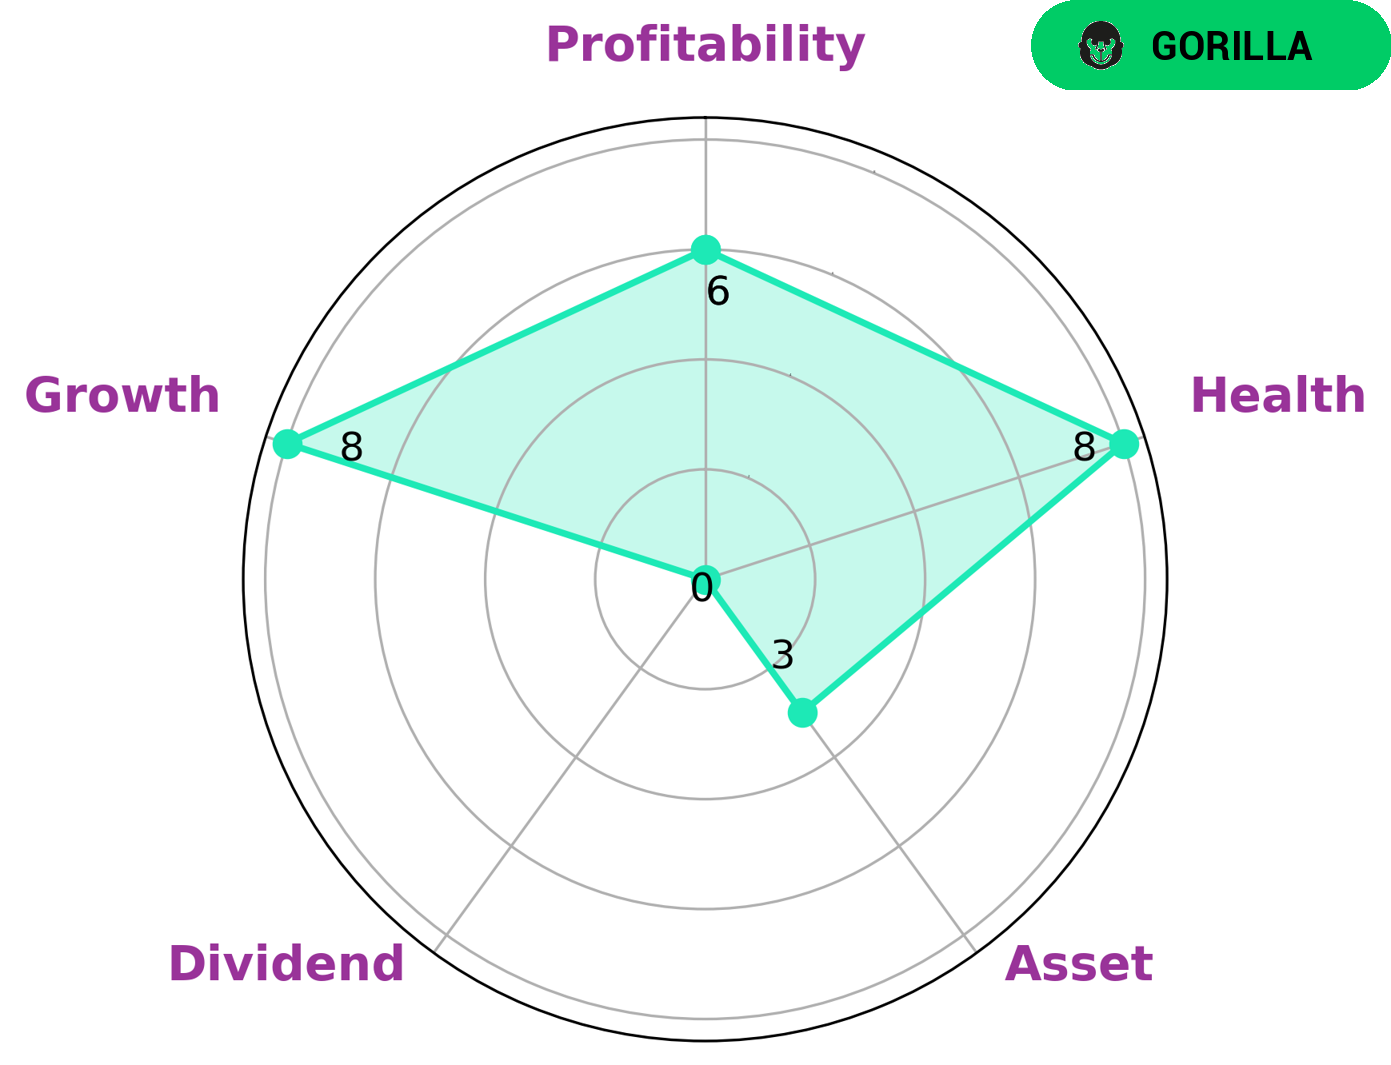
GoodWhale conducted an analysis of JANUS INTERNATIONAL‘s wellbeing and found that they were strong in growth, medium in profitability, and weak in asset and dividend. They had a high health score of 8/10, indicating that they had enough cashflows and debt to safely ride out any crisis without the risk of bankruptcy. We classified JANUS INTERNATIONAL as a ‘cheetah’ – a type of company that achieved high revenue or earnings growth but is considered less stable due to lower profitability. Given their cheetah classification, JANUS INTERNATIONAL could be of interest to investors looking for a high-risk, high-return type of investment. Such investors may also be interested in the potential for JANUS INTERNATIONAL to continue to grow despite the lower profitability score. Investors who are more averse to risk may prefer to invest in other, more stable companies with higher profitability scores. More…
Peers
Janus International Group Inc. is one of the world’s leading manufacturers of doors, windows, and related products. The company’s products are used in a wide variety of applications, including residential, commercial, and industrial. Janus International Group Inc. has a strong market presence in North America, Europe, and Asia. The company’s main competitors include Tyman PLC, Aro Granite Industries Ltd, and Deceuninck NV.
– Tyman PLC ($LSE:TYMN)
Tyman PLC is a leading global supplier of engineered industrial products. The company has a market capitalization of 416.16 million as of 2022 and a return on equity of 9.35%. Tyman operates in three segments: building products, industrial products, and water management. The building products segment provides products and solutions for the construction and maintenance of buildings, including doors, windows, stairs, and fittings. The industrial products segment offers products and solutions for the construction and maintenance of industrial facilities, such as conveyor systems, lifting equipment, and cranes. The water management segment provides products and solutions for the treatment and distribution of water, including pumps, valves, and pipes.
– Aro Granite Industries Ltd ($BSE:513729)
Aro Granite Industries Ltd is a company that manufactures and exports granite and marble products. The company has a market cap of 699.98M as of 2022 and a Return on Equity of 5.38%. Aro Granite Industries Ltd is a leading player in the granite and marble industry with a strong presence in India and overseas. The company has a diversified product portfolio and a wide distribution network. Aro Granite Industries Ltd is a publicly listed company with a strong track record of profitability and growth.
– Deceuninck NV ($LTS:0MEL)
Deceuninck NV is a Belgian company that manufactures PVC-u profile systems for the construction industry. The company has a market capitalization of 296.69 million as of 2022 and a return on equity of 9.83%. Deceuninck NV’s products are used in a variety of applications, including windows, doors, conservatories, and curtain walling. The company has a strong presence in Europe, with manufacturing facilities in Belgium, France, Germany, Poland, and the United Kingdom.
Summary
JANUS INTERNATIONAL reported its second quarter 2023 earnings results on June 30th, with total revenue increasing 9.2% year-over-year to USD 270.6 million. Net income for the quarter was up 62.0% to USD 37.0 million. In response, the company’s stock price moved up the same day.
For investors looking to invest in JANUS INTERNATIONAL, this is good news as it indicates a healthy financial performance that will likely lead to positive returns in the future. The revenue growth and increased profitability suggests that the company has strong fundamentals and is well-positioned to generate more growth in the coming quarters.
Related Posts


Recent Posts


