Janus International Intrinsic Value Calculator – JANUS INTERNATIONAL Reports Record Earnings for Q2 of FY2023
August 16, 2023

🌥️Earnings Overview
JANUS INTERNATIONAL ($NYSE:JBI) announced their financial results for the quarter ended June 30, 2023, of the fiscal year 2023. Total revenue for the period was USD 270.6 million, which was an increase of 9.2% compared to the same quarter in the previous year. Additionally, net income rose to USD 37.0 million, representing a 62.0% increase from the prior year.
Stock Price
On Thursday, JANUS INTERNATIONAL reported record earnings for the second quarter of FY2023. Stock opened at $11.7 and closed at $11.5, representing a 6.8% increase from the previous closing price of 10.8. This marked a new high for JANUS INTERNATIONAL as the company’s stock has been steadily rising in recent months. The news of record earnings drove investor confidence in the company’s future prospects, with many expecting its stock to continue to increase in value. JANUS INTERNATIONAL’s share price has nearly doubled since the beginning of the year, and analysts predict that the trend could continue in the near future.
The company’s impressive record of growth is attributed to a variety of factors, including its innovative approach to product development, strong customer service, and well-developed marketing strategies. JANUS INTERNATIONAL also benefits from being a leader in the industry, offering a wide range of products and services to customers around the world. With its record earnings for Q2, it is clear that JANUS INTERNATIONAL is continuing to make great strides in its industry. Investors are clearly encouraged by this news, and it is likely that the company will continue to report positive financial results for the foreseeable future. Live Quote…
About the Company
Income Snapshot
Below shows the total revenue, net income and net margin for Janus International. More…
| Total Revenues | Net Income | Net Margin |
| 1.06k | 128.08 | 12.0% |
Cash Flow Snapshot
Below shows the cash from operations, investing and financing for Janus International. More…
| Operations | Investing | Financing |
| 141.91 | -14.06 | -58.48 |
Balance Sheet Snapshot
Below shows the total assets, liabilities and book value per share for Janus International. More…
| Total Assets | Total Liabilities | Book Value Per Share |
| 1.29k | 845.15 | 3.02 |
Key Ratios Snapshot
Some of the financial key ratios for Janus International are shown below. More…
| 3Y Rev Growth | 3Y Operating Profit Growth | Operating Margin |
| – | – | 21.4% |
| FCF Margin | ROE | ROA |
| 12.1% | 33.6% | 11.1% |
Analysis – Janus International Intrinsic Value Calculator
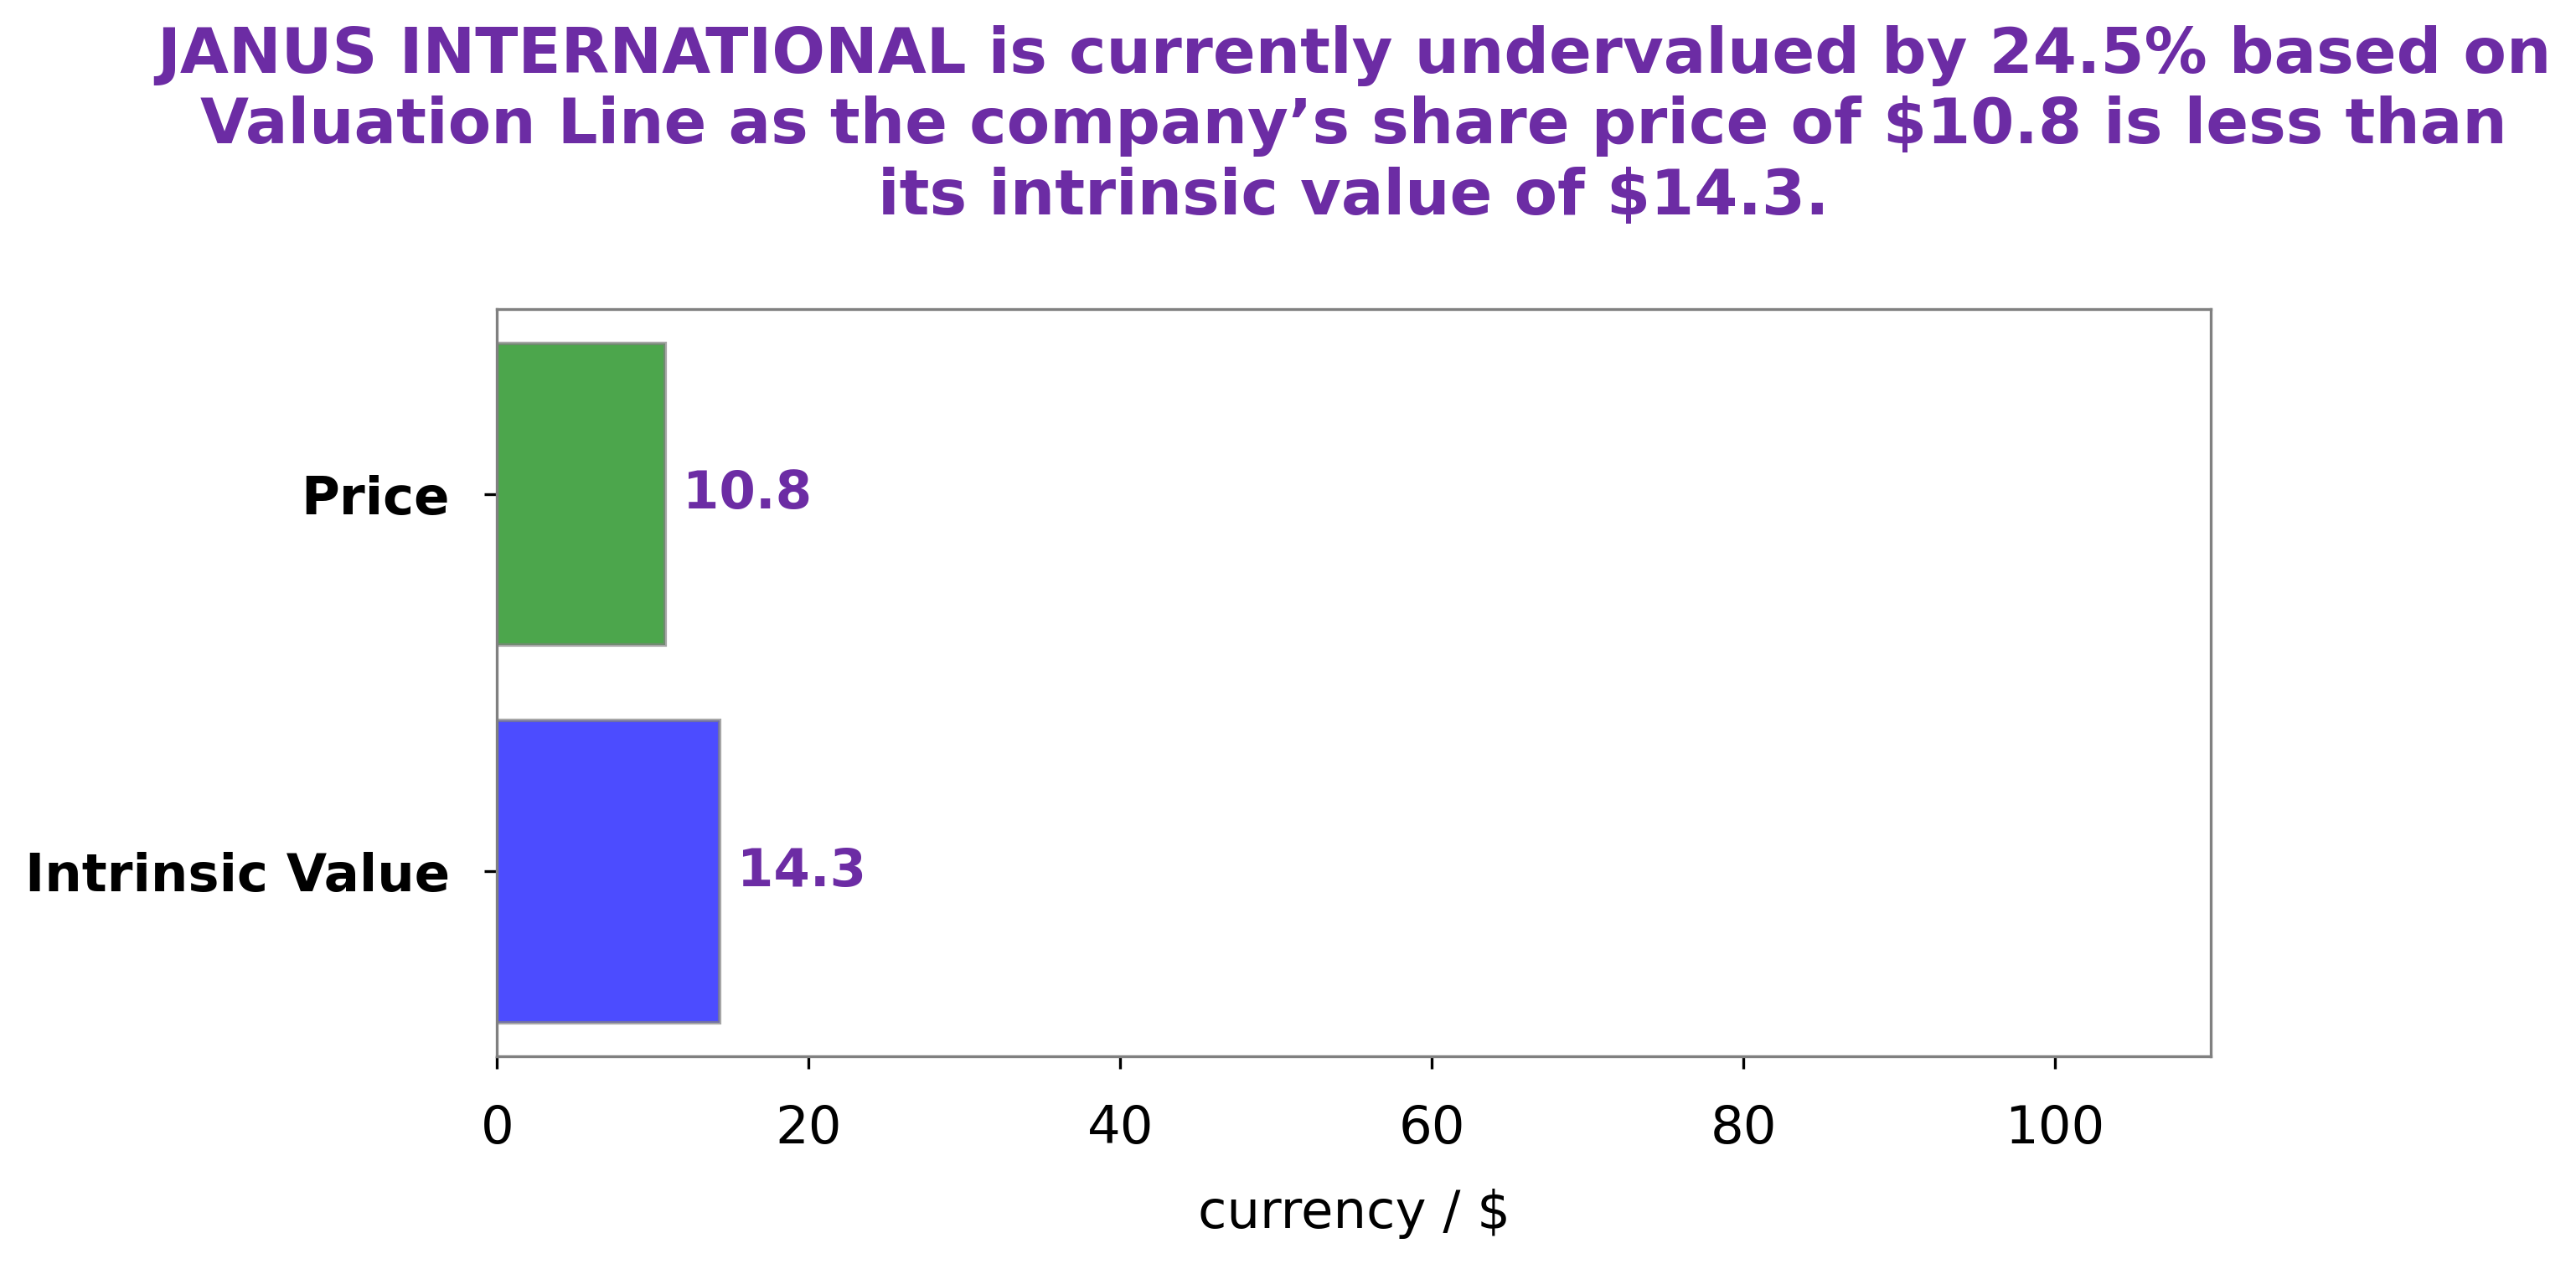
At GoodWhale, we have conducted an analysis of JANUS INTERNATIONAL‘s fundamentals and have determined that the intrinsic value of JANUS INTERNATIONAL share is around $14.9. This value was calculated using our proprietary Valuation Line. Currently, the stock is trading at $11.5, indicating that it is undervalued by 23.0%. This provides a great opportunity for investors to capitalize on the potential upside created by closing this gap between current market price and intrinsic value. More…
Peers
Janus International Group Inc. is one of the world’s leading manufacturers of doors, windows, and related products. The company’s products are used in a wide variety of applications, including residential, commercial, and industrial. Janus International Group Inc. has a strong market presence in North America, Europe, and Asia. The company’s main competitors include Tyman PLC, Aro Granite Industries Ltd, and Deceuninck NV.
– Tyman PLC ($LSE:TYMN)
Tyman PLC is a leading global supplier of engineered industrial products. The company has a market capitalization of 416.16 million as of 2022 and a return on equity of 9.35%. Tyman operates in three segments: building products, industrial products, and water management. The building products segment provides products and solutions for the construction and maintenance of buildings, including doors, windows, stairs, and fittings. The industrial products segment offers products and solutions for the construction and maintenance of industrial facilities, such as conveyor systems, lifting equipment, and cranes. The water management segment provides products and solutions for the treatment and distribution of water, including pumps, valves, and pipes.
– Aro Granite Industries Ltd ($BSE:513729)
Aro Granite Industries Ltd is a company that manufactures and exports granite and marble products. The company has a market cap of 699.98M as of 2022 and a Return on Equity of 5.38%. Aro Granite Industries Ltd is a leading player in the granite and marble industry with a strong presence in India and overseas. The company has a diversified product portfolio and a wide distribution network. Aro Granite Industries Ltd is a publicly listed company with a strong track record of profitability and growth.
– Deceuninck NV ($LTS:0MEL)
Deceuninck NV is a Belgian company that manufactures PVC-u profile systems for the construction industry. The company has a market capitalization of 296.69 million as of 2022 and a return on equity of 9.83%. Deceuninck NV’s products are used in a variety of applications, including windows, doors, conservatories, and curtain walling. The company has a strong presence in Europe, with manufacturing facilities in Belgium, France, Germany, Poland, and the United Kingdom.
Summary
JANUS INTERNATIONAL recently released their Q2 FY2023 earnings report, which showed a 9.2% increase in total revenue and a 62.0% rise in net income compared to the same period of the previous year. This positive performance led to an increase in the company’s stock price on the same day. Investors may be encouraged by the strong financial performance of JANUS INTERNATIONAL and may be interested in investing in the company due to its improving financial outlook. However, potential investors should research the company further before making any decisions.


