INTERFACE Reports Record Q2 Earnings for FY2023
August 9, 2023

🌥️Earnings Overview
INTERFACE ($NASDAQ:TILE) released its financial results for the second quarter of FY2023, which concluded on June 30 2023, on August 4 2023. Total revenue was USD 329.6 million, a 4.9% decrease compared to the same quarter from the prior year. Net income also decreased 6.1% year over year to USD 15.8 million.
Stock Price
On Friday, INTERFACE reported record Q2 earnings for FY2023, with their stock opening at $10.1 and closing at $9.8, down by 0.8% from its previous closing price of $9.8. The news of their record earnings has caused investors to take a closer look at the company and what the future may hold. As of now, INTERFACE’s stock is up year-to-date, and their Q2 earnings demonstrate their continued success in spite of the turbulence in the market. Their strong financials have investors believing that the company is set to continue to grow and increase profits. Moreover, the company’s performance in the second quarter has been especially impressive given the current challenging economic conditions.
As such, analysts are optimistic that INTERFACE is well-positioned for continued success in the remainder of FY2023 and beyond. Overall, INTERFACE’s strong financial performance in Q2 has been a welcome sign for investors, who are hoping for continued growth and steady profits from the company. With this in mind, it will be interesting to see what the future holds for INTERFACE in coming quarters. Live Quote…
About the Company
Income Snapshot
Below shows the total revenue, net income and net margin for Interface. More…
| Total Revenues | Net Income | Net Margin |
| 1.29k | 4.47 | 1.9% |
Cash Flow Snapshot
Below shows the cash from operations, investing and financing for Interface. More…
| Operations | Investing | Financing |
| 103.69 | -14.05 | -90.07 |
Balance Sheet Snapshot
Below shows the total assets, liabilities and book value per share for Interface. More…
| Total Assets | Total Liabilities | Book Value Per Share |
| 1.22k | 835.05 | 6.63 |
Key Ratios Snapshot
Some of the financial key ratios for Interface are shown below. More…
| 3Y Rev Growth | 3Y Operating Profit Growth | Operating Margin |
| 1.4% | -12.6% | 3.8% |
| FCF Margin | ROE | ROA |
| 6.4% | 8.1% | 2.5% |
Analysis
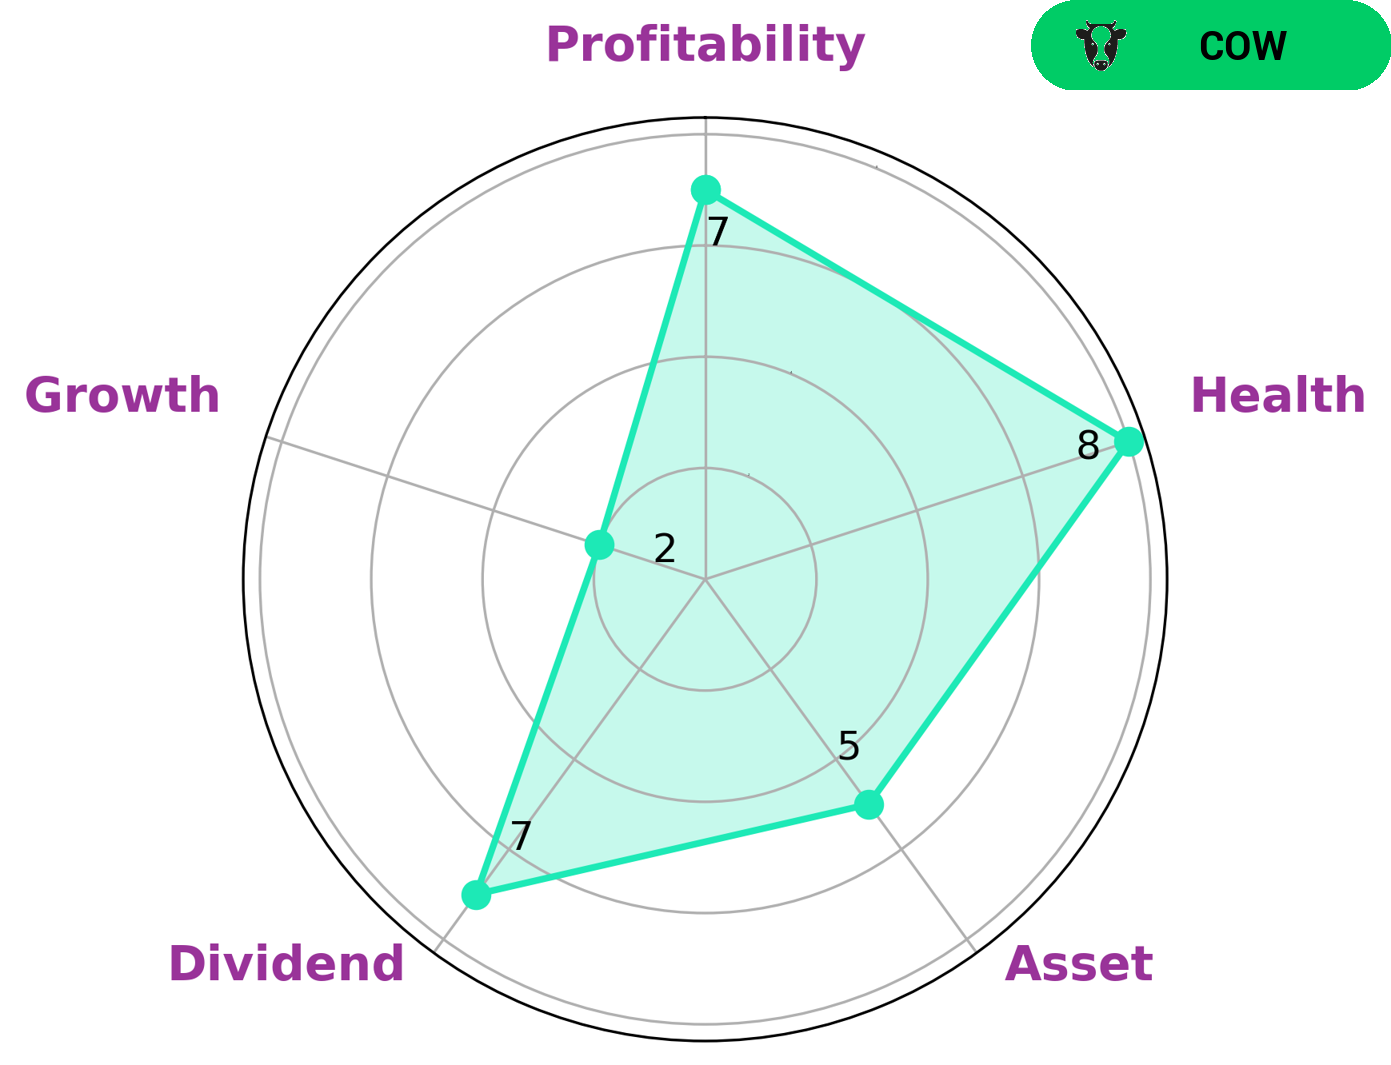
At GoodWhale, we have conducted an analysis of INTERFACE‘s financials. According to our Star Chart, INTERFACE is strong in dividend, profitability, and medium in asset. However, it is weak in growth. Investors who are looking for a steady stream of income may be interested in such a company. INTERFACE has a high health score of 8/10 considering its cashflows and debt, making it capable to sustain future operations even in times of crisis. More…
Peers
Interface Inc, a US-based company, is one of the world’s leading manufacturers of floorcoverings. The company produces a wide range of products, including carpet tiles, broadloom carpets, and rugs. Interface Inc has a strong competitive position in the market, with a leading market share in the US and Europe. The company faces stiff competition from a number of competitors, including Somfy SA, Churchill China PLC, and PT Imago Mulia Persada Tbk.
– Somfy SA ($LTS:0RR3)
Somfy SA is a French company that manufactures and markets motors and controls for blinds, awnings, curtains, gates, and garage doors. The company also manufactures and markets home automation products. As of 2022, Somfy SA had a market capitalization of 3.42 billion euros and a return on equity of 12.25%. The company’s products are sold in more than 60 countries around the world.
– Churchill China PLC ($LSE:CHH)
Churchill China PLC is a leading supplier of ceramic tableware to the hotel, restaurant and catering industry in the United Kingdom. The company has a market cap of 142.97M as of 2022 and a Return on Equity of 13.12%. Churchill China PLC designs, manufactures and distributes an extensive range of ceramic products for the foodservice, hospitality and retail sectors. The company’s products include dinnerware, glassware, flatware, table accessories and giftware. Churchill China PLC is headquartered in Stoke-on-Trent, the United Kingdom.
– PT Imago Mulia Persada Tbk ($IDX:LFLO)
PT Imago Mulia Persada Tbk is a publicly traded company with a market cap of 76.7 billion as of 2022. The company has a return on equity of 3.95%. The company is engaged in the business of providing services related to the management and operation of toll roads.
Summary
INTERFACE reported its second quarter FY2023 earnings on August 4 2023, with total revenue down 4.9% and net income down 6.1% when compared to the same period last year. This could indicate a potential decline in the company’s performance or changing market conditions, and investors should take note. Analysts may also want to consider trends in the company’s sales, expenses, and cash flow, as well as evaluate its strategies for future growth. Investors may also want to research its competitive landscape in order to assess the investment potential of INTERFACE stock.
Related Posts


Recent Posts


