Arcus Biosciences Intrinsic Value Calculator – ARCUS BIOSCIENCES Reports Second Quarter Earnings for Fiscal Year 2023
August 9, 2023

🌥️Earnings Overview
On June 30, 2023, ARCUS BIOSCIENCES ($NYSE:RCUS) reported their results for the second quarter of their fiscal year 2023, showing total revenue of USD 29.0 million, an 8.4% year-over-year increase. Net income was USD -75.0 million, a deterioration from the prior year’s figure of -66.6 million.
Price History
The company’s stock opened at $19.3 and finished the day down 4.3% at $18.2 from the prior closing price of 19.0. This drop in share prices reflects the overall negative sentiment around this quarter’s earnings report. The earnings report showed a slight increase in revenue, but a significant decrease in profits.
Furthermore, operating expenses increased, resulting in lower net income margins than expected. Although these earnings don’t quite meet analyst expectations, the company still remains optimistic for the future. ARCUS BIOSCIENCES is hopeful that with continued investment in research and development, as well as the development of new products, their net income can increase in coming quarters. Live Quote…
About the Company
Income Snapshot
Below shows the total revenue, net income and net margin for Arcus Biosciences. More…
| Total Revenues | Net Income | Net Margin |
| 121 | -287 | -237.2% |
Cash Flow Snapshot
Below shows the cash from operations, investing and financing for Arcus Biosciences. More…
| Operations | Investing | Financing |
| -306 | 225 | 38 |
Balance Sheet Snapshot
Below shows the total assets, liabilities and book value per share for Arcus Biosciences. More…
| Total Assets | Total Liabilities | Book Value Per Share |
| 1.22k | 654 | 7.6 |
Key Ratios Snapshot
Some of the financial key ratios for Arcus Biosciences are shown below. More…
| 3Y Rev Growth | 3Y Operating Profit Growth | Operating Margin |
| 100.6% | – | -233.1% |
| FCF Margin | ROE | ROA |
| -261.2% | -30.2% | -14.4% |
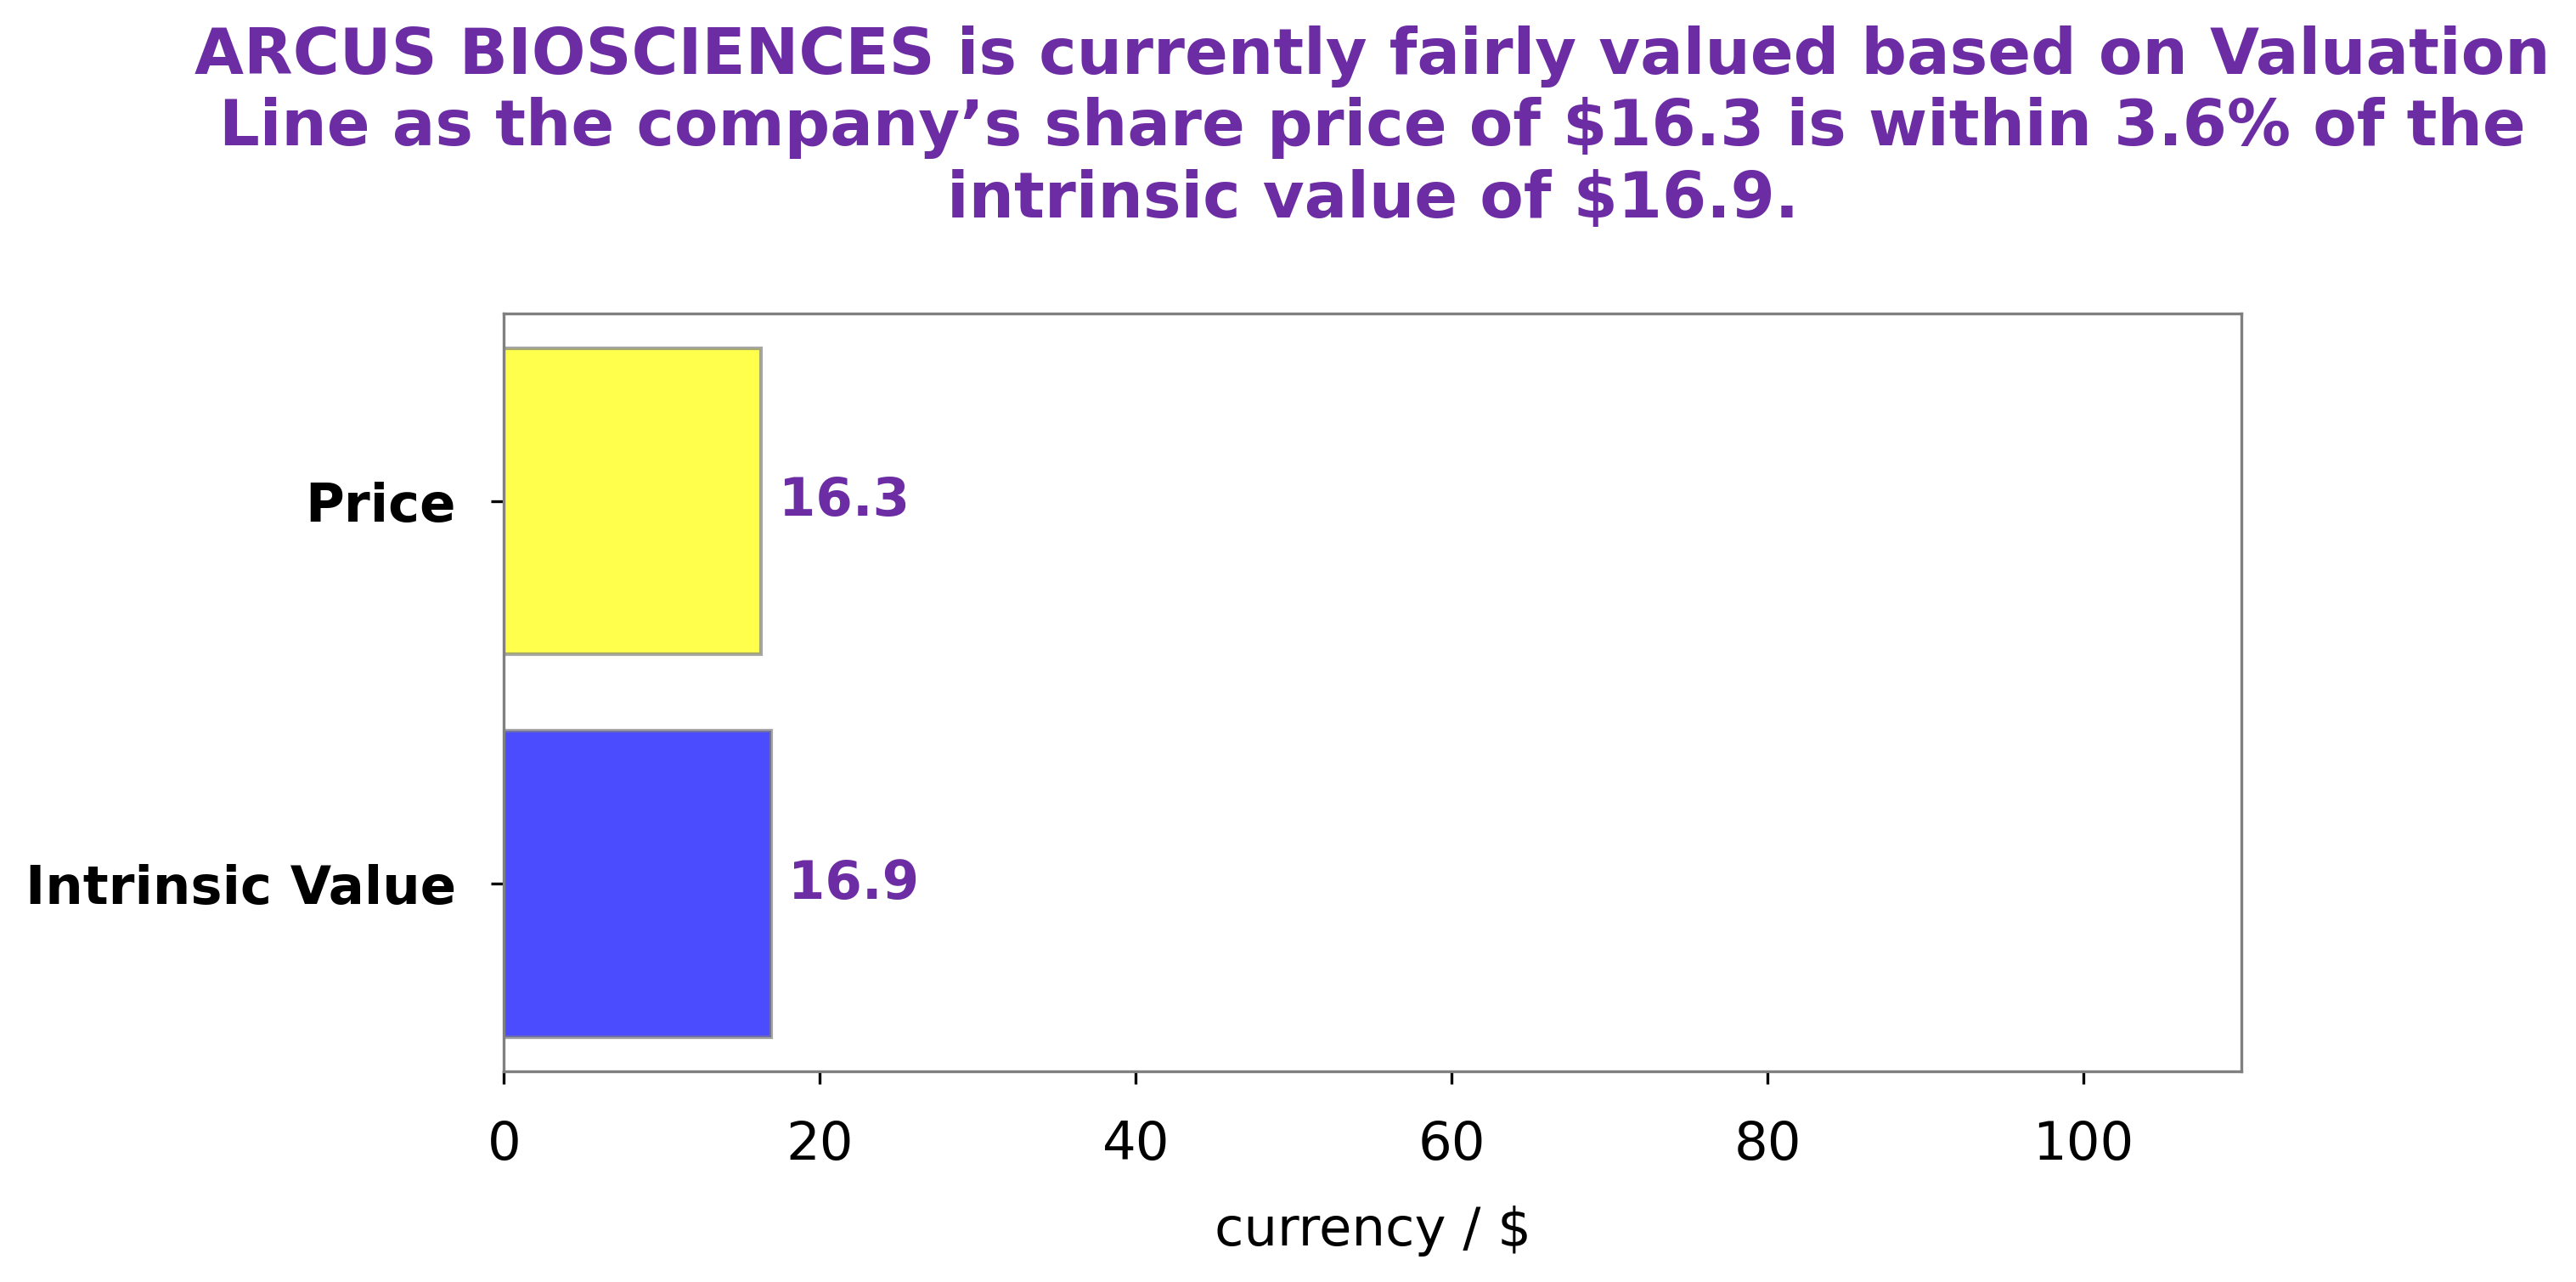
Analysis – Arcus Biosciences Intrinsic Value Calculator
At GoodWhale, we conducted an analysis of ARCUS BIOSCIENCES‘s wellbeing and found that the intrinsic value of their shares is around $25.4, as calculated by our proprietary Valuation Line. This implies that the stock is currently undervalued by 28.3%, as it is currently being traded at $18.2. As such, there may be an opportunity to buy at a discounted price before the stock rallies back to its fair market value. More…
Peers
The company’s product candidates include AB928, AB154 and AB122, which are in various clinical trials for the treatment of solid tumors and hematologic malignancies. Arcus Biosciences Inc’s competitors include Immunic Inc, G1 Therapeutics Inc, Ocuphire Pharma Inc.
– Immunic Inc ($NASDAQ:IMUX)
The company’s market cap is $56.93M as of 2022 and its ROE is -44.31%. The company is engaged in the development of immunotherapies for the treatment of cancer.
– G1 Therapeutics Inc ($NASDAQ:GTHX)
G1 Therapeutics Inc is a clinical-stage biopharmaceutical company focused on the discovery and development of small molecule therapies for the treatment of cancer. The company’s lead product candidate is trilaciclib, which is in clinical development for the treatment of small cell lung cancer (SCLC) and triple-negative breast cancer (TNBC). Trilaciclib is a first-in-class cyclin-dependent kinase 4/6 (CDK4/6) inhibitor that selectively targets proliferating cancer cells and spares normal cells. CDK4/6 inhibitors are a new class of anti-cancer drugs that block the activity of two proteins that are involved in cell division.
G1 Therapeutics has a market cap of $366.9 million and a return on equity of -159.15%. The company’s lead product candidate is trilaciclib, which is in clinical development for the treatment of small cell lung cancer (SCLC) and triple-negative breast cancer (TNBC). Trilaciclib is a first-in-class cyclin-dependent kinase 4/6 (CDK4/6) inhibitor that selectively targets proliferating cancer cells and spares normal cells. CDK4/6 inhibitors are a new class of anti-cancer drugs that block the activity of two proteins that are involved in cell division.
– Ocuphire Pharma Inc ($NASDAQ:OCUP)
Ocuphire Pharma Inc. is a clinical-stage biopharmaceutical company, which focuses on developing and commercializing therapies to treat ocular disorders. Its lead product candidate is Nyxol, a once-daily eye drop for the treatment of glaucoma and ocular hypertension. The company was founded by Derek J. Rappaport and Nancy S. Lurie on March 1, 2006 and is headquartered in Boca Raton, FL.
Summary
Investors in ARCUS BIOSCIENCES saw a decrease in stock price following the company’s Q2 2023 earnings report. Although total revenue had increased 8.4% year-over-year, net income dropped to USD -75.0 million from the previous year’s figure of -66.6 million. This could be an indication of slower growth in the near future, and investors should closely monitor ARCUS BIOSCIENCES’ performance over the next few quarters to determine how this may impact their investments.


