Akebia Therapeutics Reports Mixed Q4 Financials Despite Beating Earnings Estimate.
May 10, 2023

Trending News ☀️
The same trend was seen in their revenue, which was $40.13M—a shortfall of $6.55M against projections. Akebia Therapeutics ($NASDAQ:AKBA) is a biopharmaceutical company that develops therapies for patients with kidney diseases. It has two lead product candidates, Vadadustat and Auryxia, which are oral therapies for anemia associated with chronic kidney disease. Akebia is also exploring new treatments for other areas of kidney diseases, such as hypophosphatemia and mineral metabolism disorders. It has partnerships with several leading biopharmaceutical companies to develop and commercialize its products.
Earnings
AKEBIA THERAPEUTICS recently reported mixed financials in their Q4 earnings report for FY2022 as of December 31 2022. Total revenue earned was 55.18M USD, representing a 7.4% decrease compared to the year before. Moreover, looking at the last three years, total revenue has decreased from 56.7M USD to 55.18M USD.
About the Company
Income Snapshot
Below shows the total revenue, net income and net margin for Akebia Therapeutics. More…
| Total Revenues | Net Income | Net Margin |
| 292.6 | -92.56 | -25.9% |
Cash Flow Snapshot
Below shows the cash from operations, investing and financing for Akebia Therapeutics. More…
| Operations | Investing | Financing |
| -73.15 | -0.11 | 14.6 |
Balance Sheet Snapshot
Below shows the total assets, liabilities and book value per share for Akebia Therapeutics. More…
| Total Assets | Total Liabilities | Book Value Per Share |
| 351.83 | 342.49 | 0.08 |
Key Ratios Snapshot
Some of the financial key ratios for Akebia Therapeutics are shown below. More…
| 3Y Rev Growth | 3Y Operating Profit Growth | Operating Margin |
| -4.4% | – | -26.3% |
| FCF Margin | ROE | ROA |
| -25.0% | -414.3% | -13.7% |
Price History
Despite surpassing Wall Street expectations on earnings, its stock closed at $1.1, down 2.8% from its previous closing price. Overall, Akebia’s financial performance was mixed in the fourth quarter, but it managed to beat analyst estimates on earnings. Live Quote…
Analysis
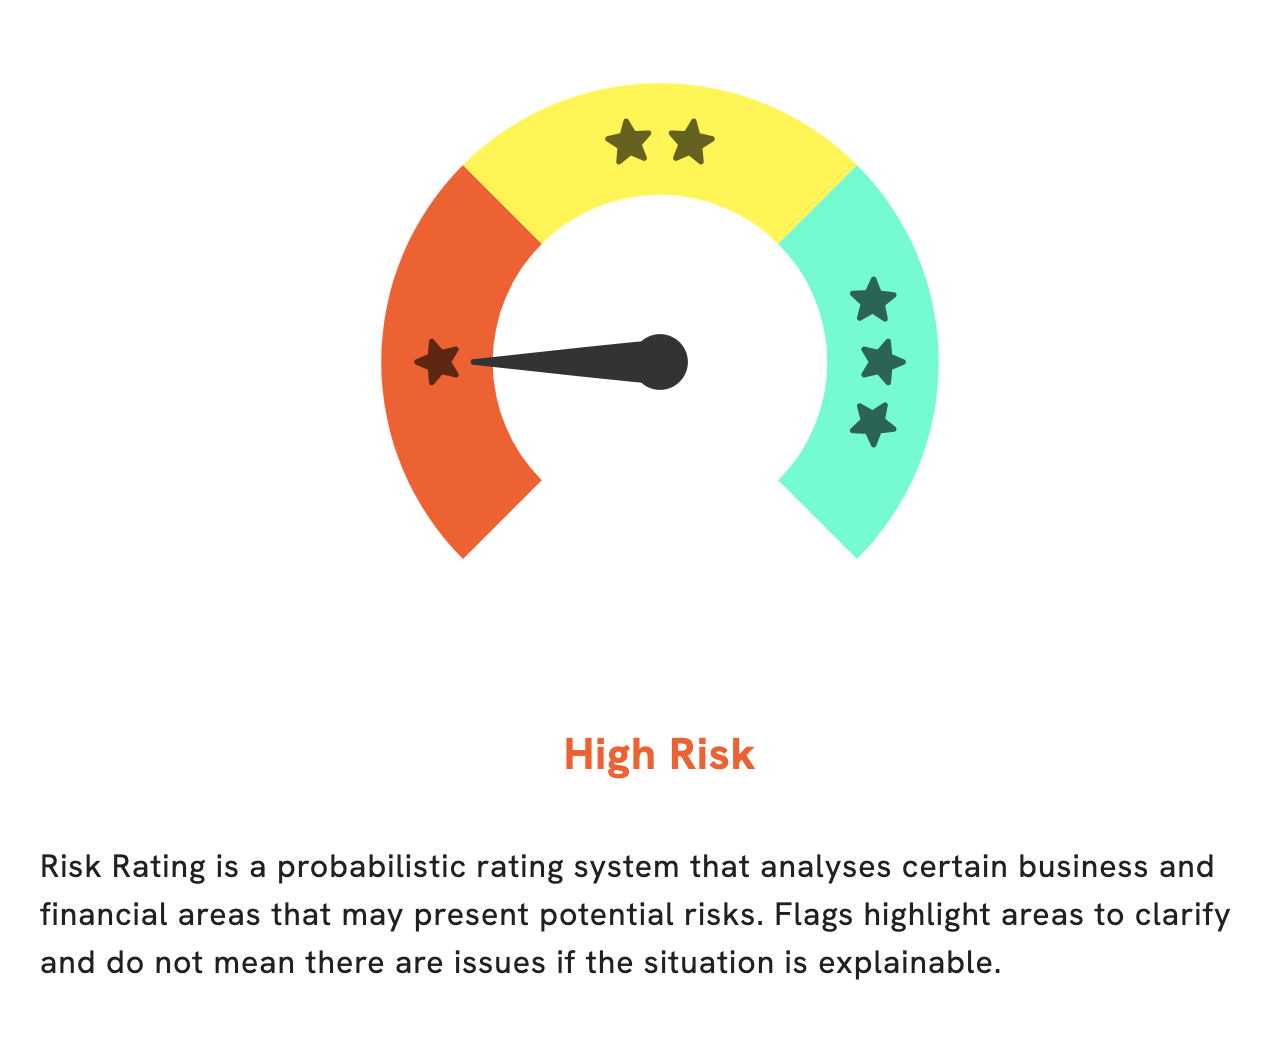
At GoodWhale, we have conducted an extensive financial analysis of AKEBIA THERAPEUTICS. Our evaluation has found that AKEBIA THERAPEUTICS is a high risk investment, due to its financial and business aspects. After taking a closer look at the income sheet, balance sheet and cashflow statement, we identified 3 immediate risk warnings. If you would like to learn more about these risks, please register with us. More…
Peers
It engages in research, development, and commercialization of small molecule therapeutics that promote kidney health. Akebia has several competitors in the market, including Nascent Biotech Inc, MEI Pharma Inc, and Albireo Pharma Inc. All these companies are working hard to develop innovative treatments for kidney diseases and other related conditions.
– Nascent Biotech Inc ($OTCPK:NBIO)
Nascent Biotech Inc is a biotechnology company that specializes in the development of novel gene therapies for cancer and other diseases. As of 2023, the company has a market cap of 13.69M and a Return on Equity of 65.07%. The market cap of Nascent Biotech Inc represents the total value of its outstanding shares, which reflects investor confidence in its products and services. The high ROE suggests that the company is making efficient use of its shareholders’ equity to generate profits and reward shareholders with dividends.
– MEI Pharma Inc ($NASDAQ:MEIP)
MEI Pharma Inc is a pharmaceutical company engaged in the development and commercialization of treatments for cancer. The company’s market cap as of 2023 was 30.56M. The Return on Equity (ROE) for the company was -68.64%. This indicates that the company has been experiencing a decrease in its shareholder equity, indicating that it is not generating enough revenue to cover its liabilities. Despite this, MEI Pharma Inc continues to pursue innovative strategies in its attempt to develop treatments for cancer.
Summary
The company’s GAAP earnings per share (EPS) were -$0.14, beating analysts’ estimates by one cent. Revenue for the quarter was reported at $40.13 million, missing the expected figure by $6.55 million. Investors should consider the company’s long-term potential when making decisions, as well as its overall financial health and product portfolio.


