Xpel Intrinsic Value – XPEL Reports Q2 FY2023 Earnings Results on June 30 2023
August 13, 2023

🌥️Earnings Overview
XPEL ($NASDAQ:XPEL) reported its earnings results for the second quarter of FY2023 on June 30 2023, with total revenue of USD 102.2 million, demonstrating a 21.9% year-over-year increase. Net income was USD 15.7 million, reflecting a 32.3% year-over-year increase.
Market Price
On June 30 2023, XPEL (NYSE: XPEL) released their Q2 FY2023 financial results. On Wednesday, the company’s stock opened at $79.0 and closed at $74.1, representing a 7.9% drop from the prior closing price of $80.5. This was largely due to a lower than expected earnings report from the company, which showed a slight decline year-over-year. The company’s expenses were also higher than the prior year, likely due to increased costs associated with the introduction of new services offered to customers.
The company’s stock was affected by the lower than expected earnings report, however there were some positive takeaways from the quarterly report. This could bode well for future growth and potentially help offset any losses experienced from lower than expected revenue or net income for the quarter. xpel&utm_title=XPEL_Reports_Q2_FY2023_Earnings_Results_on_June_30_2023″>Live Quote…
About the Company
Income Snapshot
Below shows the total revenue, net income and net margin for Xpel. More…
| Total Revenues | Net Income | Net Margin |
| 356.32 | 48.85 | 13.7% |
Cash Flow Snapshot
Below shows the cash from operations, investing and financing for Xpel. More…
| Operations | Investing | Financing |
| 41.95 | -17.82 | -19.21 |
Balance Sheet Snapshot
Below shows the total assets, liabilities and book value per share for Xpel. More…
| Total Assets | Total Liabilities | Book Value Per Share |
| 216.66 | 63.35 | 5.55 |
Key Ratios Snapshot
Some of the financial key ratios for Xpel are shown below. More…
| 3Y Rev Growth | 3Y Operating Profit Growth | Operating Margin |
| 36.8% | 51.3% | 17.7% |
| FCF Margin | ROE | ROA |
| 9.3% | 27.2% | 18.2% |
Analysis – Xpel Intrinsic Value
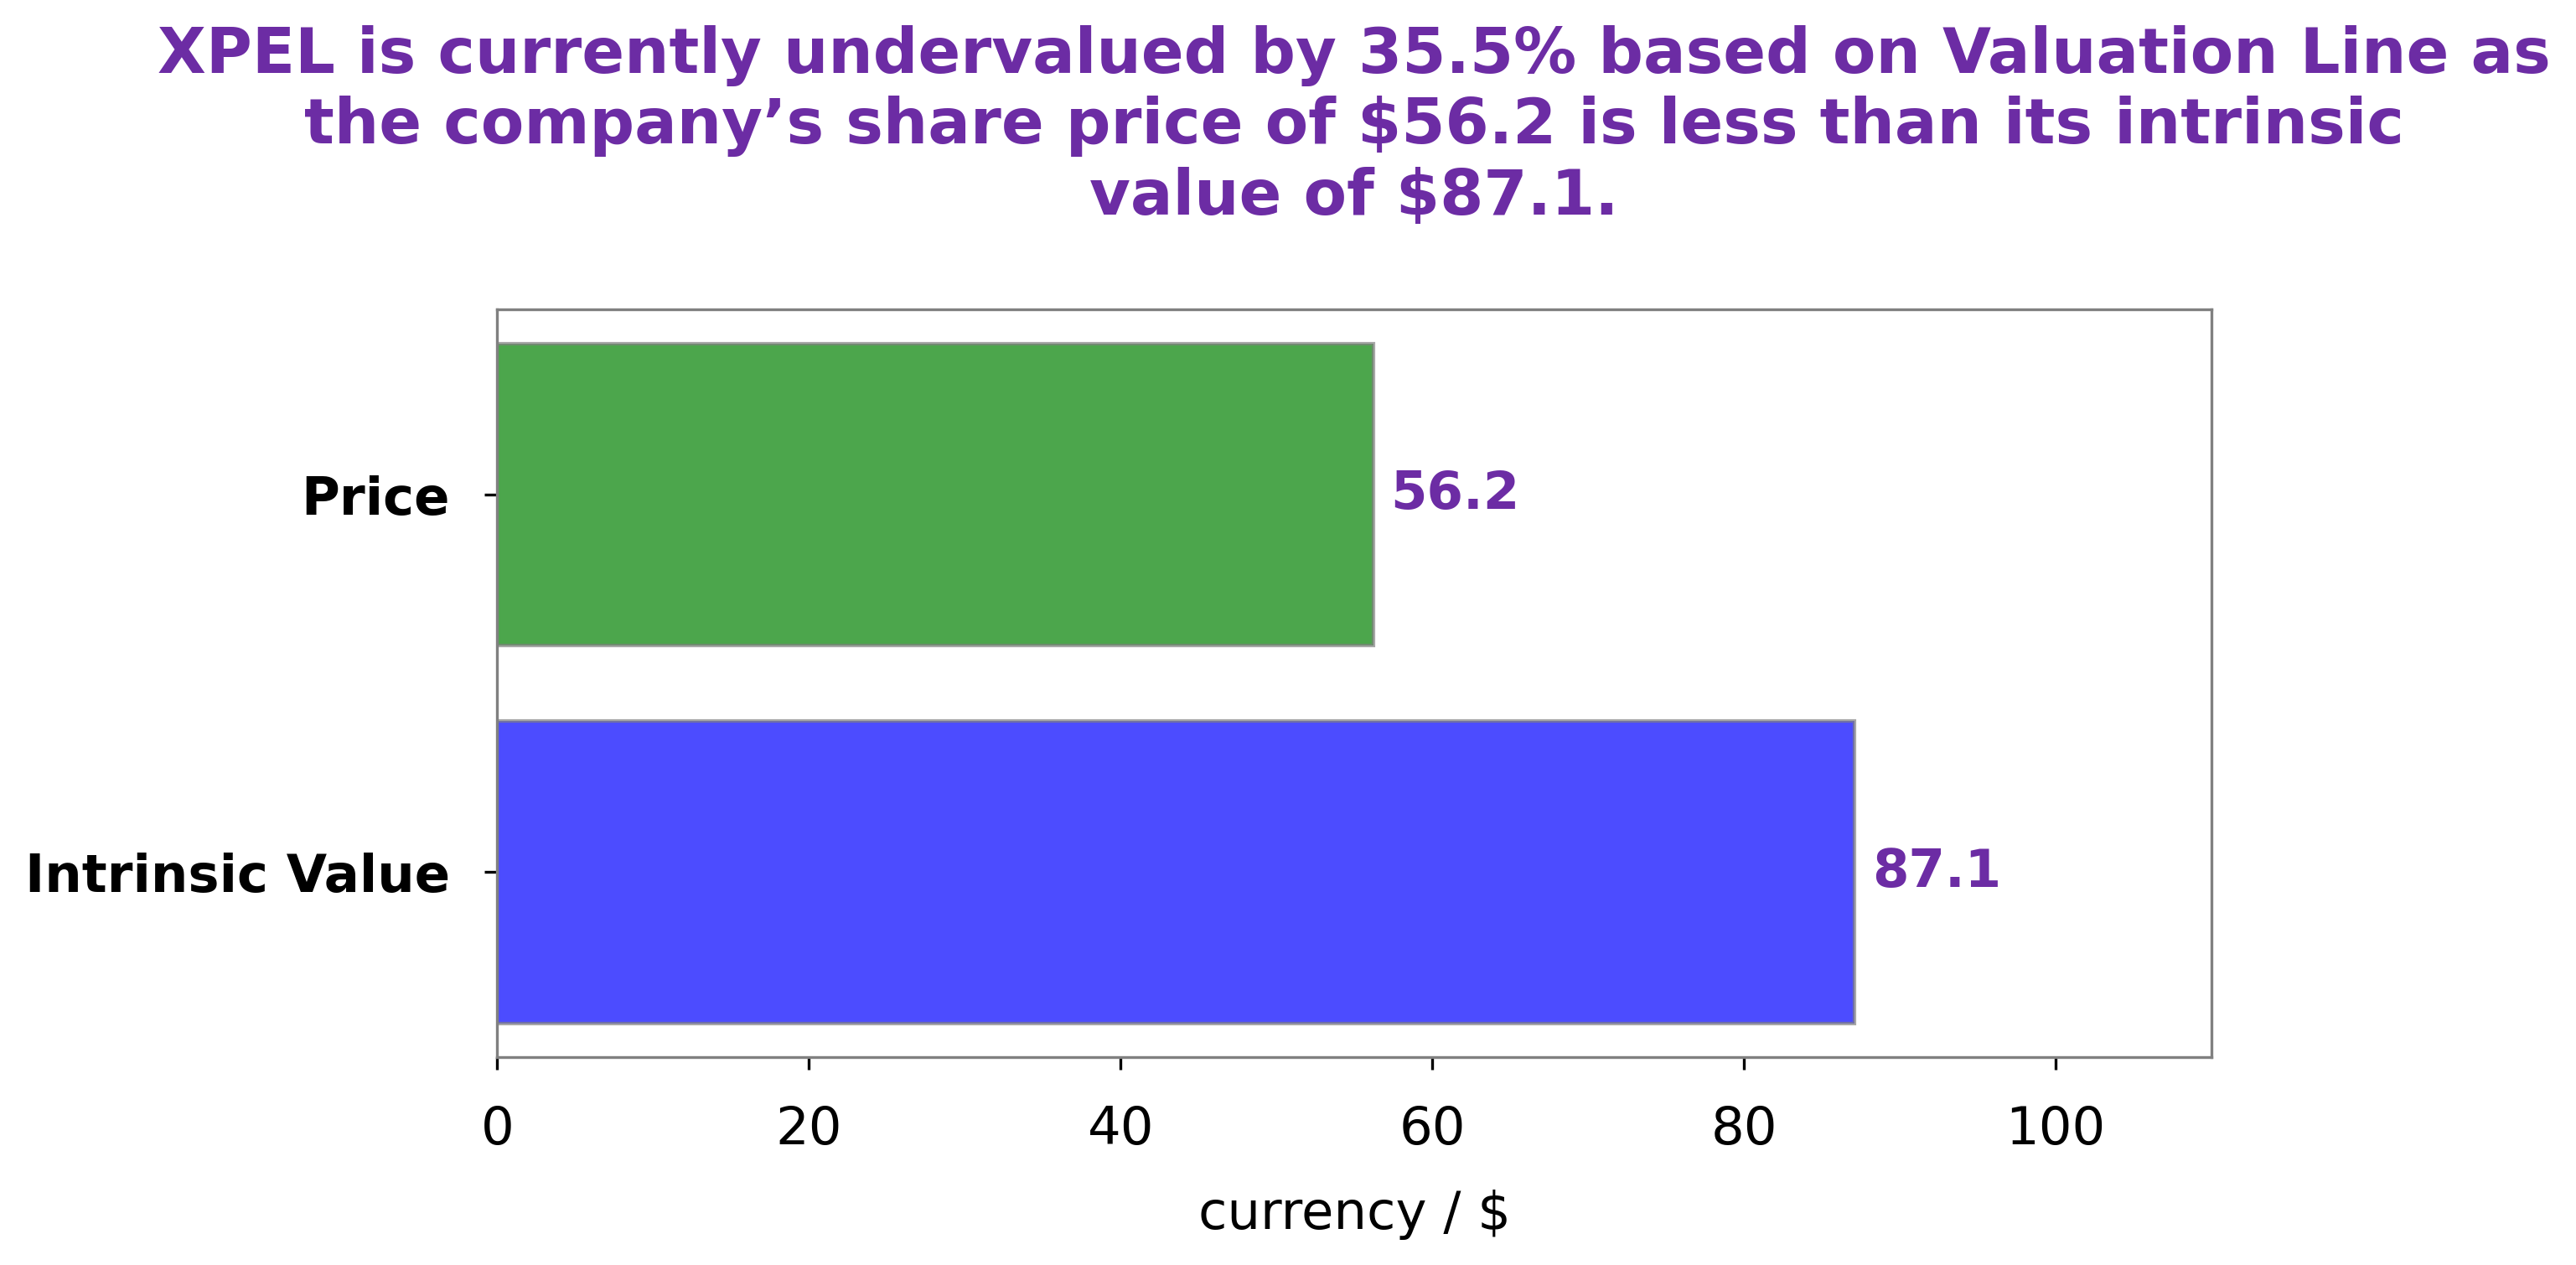
GoodWhale recently conducted a thorough analysis of XPEL’s wellbeing and concluded that the fair value of XPEL shares is around $85.6, as determined by our proprietary Valuation Line. Currently, XPEL stock is being traded at $74.1, which makes XPEL a fair price that is undervalued by 13.4%. We believe this discrepancy presents a great opportunity for investors to purchase XPEL stock at a discounted rate. xpel&utm_title=XPEL_Reports_Q2_FY2023_Earnings_Results_on_June_30_2023″>More…
Peers
In the automotive industry, there are many suppliers of aftermarket paint and film protection products. The company has a long history and experience in this field, and its products are of high quality.
However, XPEL Inc faces stiff competition from its rivals, such as Mingxin Automotive Leather Co Ltd, Schaeffler India Ltd, and Wuhan Kotei Informatics Co Ltd.
– Mingxin Automotive Leather Co Ltd ($SHSE:605068)
Mingxin Automotive Leather Co Ltd is a publicly traded company with a market capitalization of 4.83 billion as of 2022. The company’s return on equity is 3.57%. Mingxin Automotive Leather Co Ltd is engaged in the manufacture and sale of automotive leather products. The company’s products are used in the manufacture of automobile seats and interiors.
– Schaeffler India Ltd ($BSE:505790)
Schaeffler India Ltd is an automotive and industrial supplier of bearings, components and services with a market cap of 462.71B as of 2022. The company has a Return on Equity of 18.35%. Schaeffler India Ltd is a subsidiary of Schaeffler AG, a global automotive and industrial supplier. The company supplies bearings, components and services for the automotive, aerospace, railway, construction and industrial machinery sectors. Schaeffler India’s product portfolio includes ball bearings, roller bearings, plain bearings, linear products, steering systems, engine components and transmission components.
– Wuhan Kotei Informatics Co Ltd ($SZSE:301221)
Wuhan Kotei Informatics Co Ltd is a Chinese company that specializes in big data and artificial intelligence. The company has a market cap of 4.41B as of 2022 and a Return on Equity of 1.0%. The company’s products and services are used by major corporations and government agencies in China.
Summary
XPEL Inc. saw strong growth in its second quarter of FY2023, with total revenue of USD 102.2 million, up 21.9% year-over-year, and net income of USD 15.7 million, an increase of 32.3% year-over-year. Despite these impressive results, the stock price fell the same day. From an investment perspective, XPEL appears to be a sound choice due to its growing revenues and profitability. The company’s strong fundamentals leave room for potential future growth, making it a compelling option for investors looking for long-term gains.


