VIRTUS INVESTMENT PARTNERS Reports Q2 FY2023 Earnings Results on July 28, 2023
August 21, 2023

🌥️Earnings Overview
On July 28, 2023, VIRTUS INVESTMENT PARTNERS ($NASDAQ:VRTS) reported their earnings results for the second quarter of FY2023 ending June 30, 2023. Revenue for the quarter was USD 212.3 million, a drop of 5.3% compared to the same period last year. Net income, however, rose significantly by 73.9%, to USD 30.3 million, year over year.
Market Price
On Friday, July 28th, 2023, VIRTUS INVESTMENT PARTNERS reported their earnings results for the second quarter of fiscal year 2023. Following the announcement, the company’s stock opened at a price of $202.3 but closed at a lower price of $201.8, a decrease of 4.3% from their previous closing price of $210.8. The results indicate that VIRTUS INVESTMENT PARTNERS performance in the second quarter was weaker than expected, leading to a decrease in their stock prices. The company is now expected to focus on improving their quarterly results for the rest of the year in order to boost investor confidence and bring back their stock to more profitable levels.
Overall, VIRTUS INVESTMENT PARTNERS seems to be underperforming compared to other financial firms in the market. It will be interesting to see if the company can turn things around and return to profitability in the coming quarters. Live Quote…
About the Company
Income Snapshot
Below shows the total revenue, net income and net margin for VRTS. More…
| Total Revenues | Net Income | Net Margin |
| 815.73 | 135.96 | 16.9% |
Cash Flow Snapshot
Below shows the cash from operations, investing and financing for VRTS. More…
| Operations | Investing | Financing |
| 171.49 | -27.47 | -102.06 |
Balance Sheet Snapshot
Below shows the total assets, liabilities and book value per share for VRTS. More…
| Total Assets | Total Liabilities | Book Value Per Share |
| 3.7k | 2.75k | 116.83 |
Key Ratios Snapshot
Some of the financial key ratios for VRTS are shown below. More…
| 3Y Rev Growth | 3Y Operating Profit Growth | Operating Margin |
| 12.8% | 4.8% | 37.8% |
| FCF Margin | ROE | ROA |
| 20.3% | 22.8% | 5.2% |
Analysis
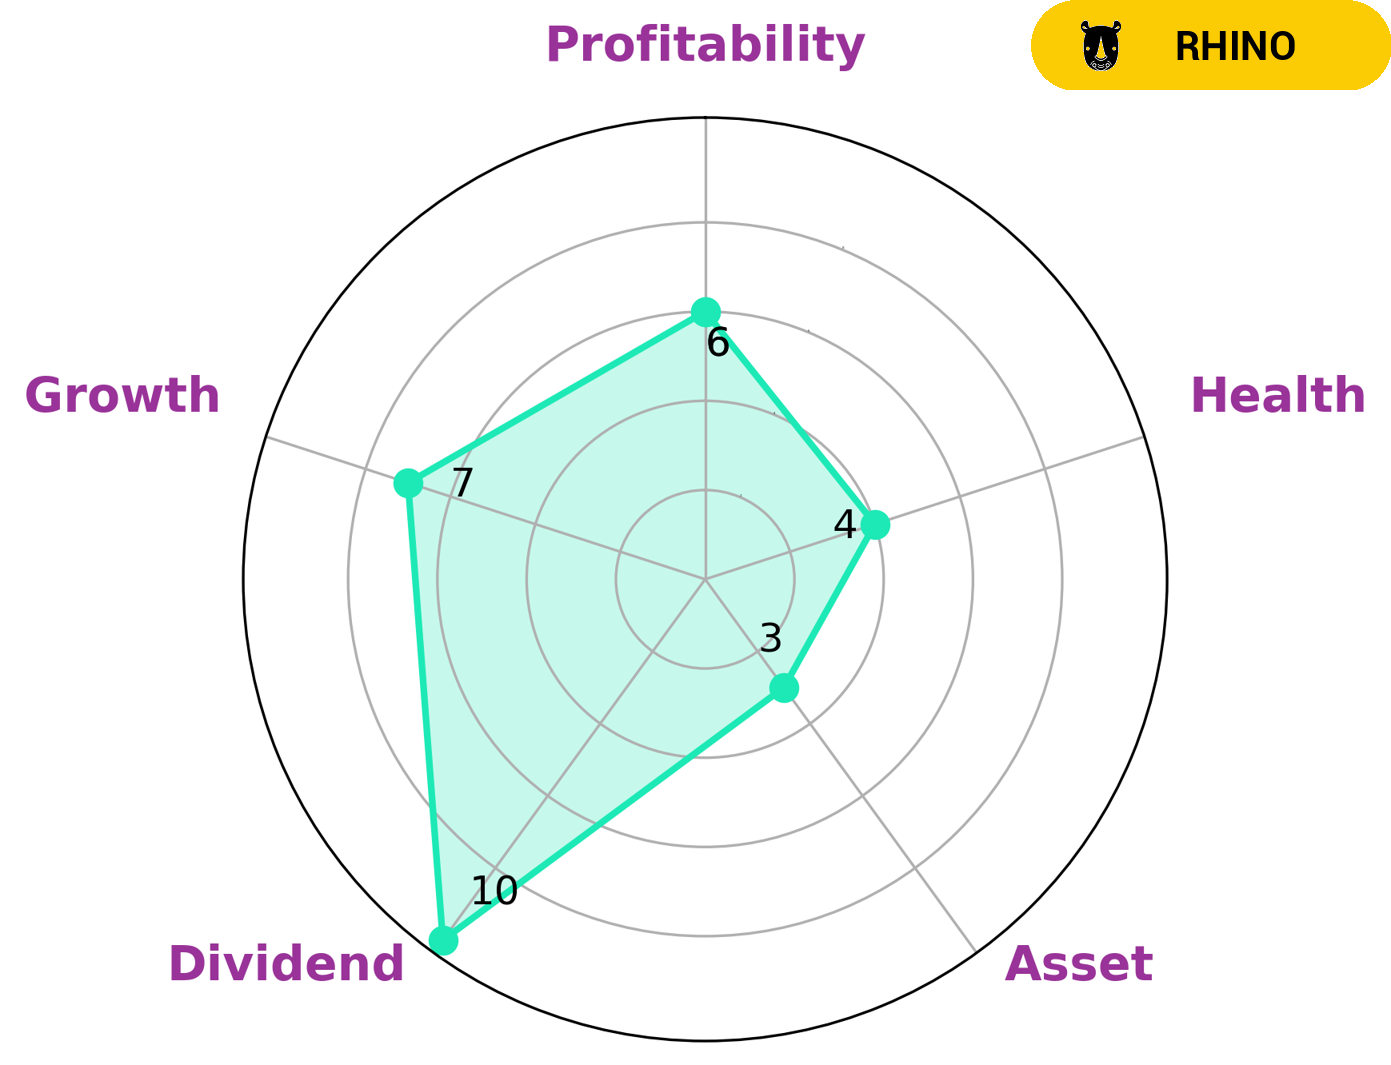
GoodWhale’s analysis of VIRTUS INVESTMENT PARTNERS’s financials reveals that it is classified as a ‘rhino’, indicating that the company has achieved moderate revenue or earnings growth. This makes VIRTUS INVESTMENT PARTNERS an attractive target for investors looking for a steady return on their investment, as well as those seeking the potential for capital gains. Furthermore, VIRTUS INVESTMENT PARTNERS is strong in dividend and growth, and medium in profitability and asset. Additionally, GoodWhale’s analysis gave VIRTUS INVESTMENT PARTNERS an intermediate health score of 4/10 with regard to its cashflows and debt, which suggests that the company is likely to pay off its debt and have enough money to fund future operations. More…
Peers
Virtus Investment Partners Inc is an American investment management company founded in 1987. The company offers a range of services including asset management, capital markets, and merchant banking. Virtus Investment Partners Inc has a market capitalization of $4.85 billion as of 2019. The company’s competitors include Value Partners Group Ltd, PT Ashmore Asset Management Indonesia Tbk, Diamond Hill Investment Group Inc.
– Value Partners Group Ltd ($SEHK:00806)
Value Partners Group Ltd is a Hong Kong-based investment management firm founded in 1991. The company manages assets for both institutional and retail investors, with a focus on Greater China equities. As of 2022, Value Partners Group Ltd had a market cap of 3.5B and a Return on Equity of -1.94%. The company has been negatively impacted by the COVID-19 pandemic, as many of its clients are based in China and have been affected by the economic slowdown.
– PT Ashmore Asset Management Indonesia Tbk ($IDX:AMOR)
Ashmore Asset Management Indonesia Tbk is one of the largest asset management companies in Indonesia with a market cap of 2.48T as of 2022. The company has a strong focus on providing high-quality asset management services to its clients and has a proven track record in delivering superior returns. The company’s ROE of 33.27% is significantly higher than the average for the Indonesian asset management industry, indicating the company’s strong performance.
– Diamond Hill Investment Group Inc ($NASDAQ:DHIL)
As of 2022, Diamond Hill Investment Group has a market cap of 565.61M and a ROE of 29.78%. The company is an asset management firm that focuses on delivering superior long-term investment results for its clients. Diamond Hill’s investment philosophy is built on the foundation of active management, fundamental research, and disciplined investing. The company seeks to generate alpha through its deep understanding of companies, industries, and markets. Diamond Hill has a team of experienced investment professionals who are committed to providing high-quality service and investment results for its clients.
Summary
VIRTUS INVESTMENT PARTNERS reported their second quarter earnings for FY2023 ending June 30, 2023 and total revenue was USD 212.3 million, representing a 5.3% decrease year over year. Net income, however, increased 73.9% to USD 30.3 million. Following the earnings announcement, the stock price of VIRTUS INVESTMENT PARTNERS moved down.
For investors, it is important to consider the earnings report carefully to gain insight into the performance of the company and evaluate its future prospects. It is also important to consider other factors such as management performance, competitive landscape, and macroeconomic conditions.
Related Posts


Recent Posts


