INVESCO LTD Reports Financial Results for Q2 FY2023
August 9, 2023

🌥️Earnings Overview
INVESCO LTD ($NYSE:IVZ) reported their financial results for the second quarter of FY2023 on June 30th, 2023. Total revenue for the quarter was USD 1442.8 million, which was a 5.7% drop compared to the same period in the prior year. Net income for the period, however, increased 6.2% year over year, totaling USD 191.4 million.
Price History
The company’s stock opened at $17.4 and closed at $16.6, a drop of 7.5% from the prior closing price of $18.0. INVESCO LTD released a statement accompanying the results stating that the decrease was largely driven by external factors such as market volatility and macroeconomic conditions, though it also noted that internal operations had not met the company’s expectations. INVESCO LTD had indicated earlier that it expected revenues to decline, though not as drastically as they did in the report. Looking ahead, INVESCO LTD is optimistic that its long-term focus on digital transformation and customer experience will help to improve profitability and drive future growth.
The company has stated that it is committed to delivering value to shareholders by pursuing various strategies, including cost reduction and innovation. INVESCO LTD also plans to continue to focus on investment and new product offerings in order to provide its customers with the best possible experience. Live Quote…
About the Company
Income Snapshot
Below shows the total revenue, net income and net margin for Invesco Ltd. More…
| Total Revenues | Net Income | Net Margin |
| 5.75k | 642.4 | 15.6% |
Cash Flow Snapshot
Below shows the cash from operations, investing and financing for Invesco Ltd. More…
| Operations | Investing | Financing |
| 1.19k | -269 | -783.5 |
Balance Sheet Snapshot
Below shows the total assets, liabilities and book value per share for Invesco Ltd. More…
| Total Assets | Total Liabilities | Book Value Per Share |
| 29.46k | 12.75k | 34.17 |
Key Ratios Snapshot
Some of the financial key ratios for Invesco Ltd are shown below. More…
| 3Y Rev Growth | 3Y Operating Profit Growth | Operating Margin |
| -3.9% | -11.5% | 20.6% |
| FCF Margin | ROE | ROA |
| 18.3% | 4.8% | 2.5% |
Analysis
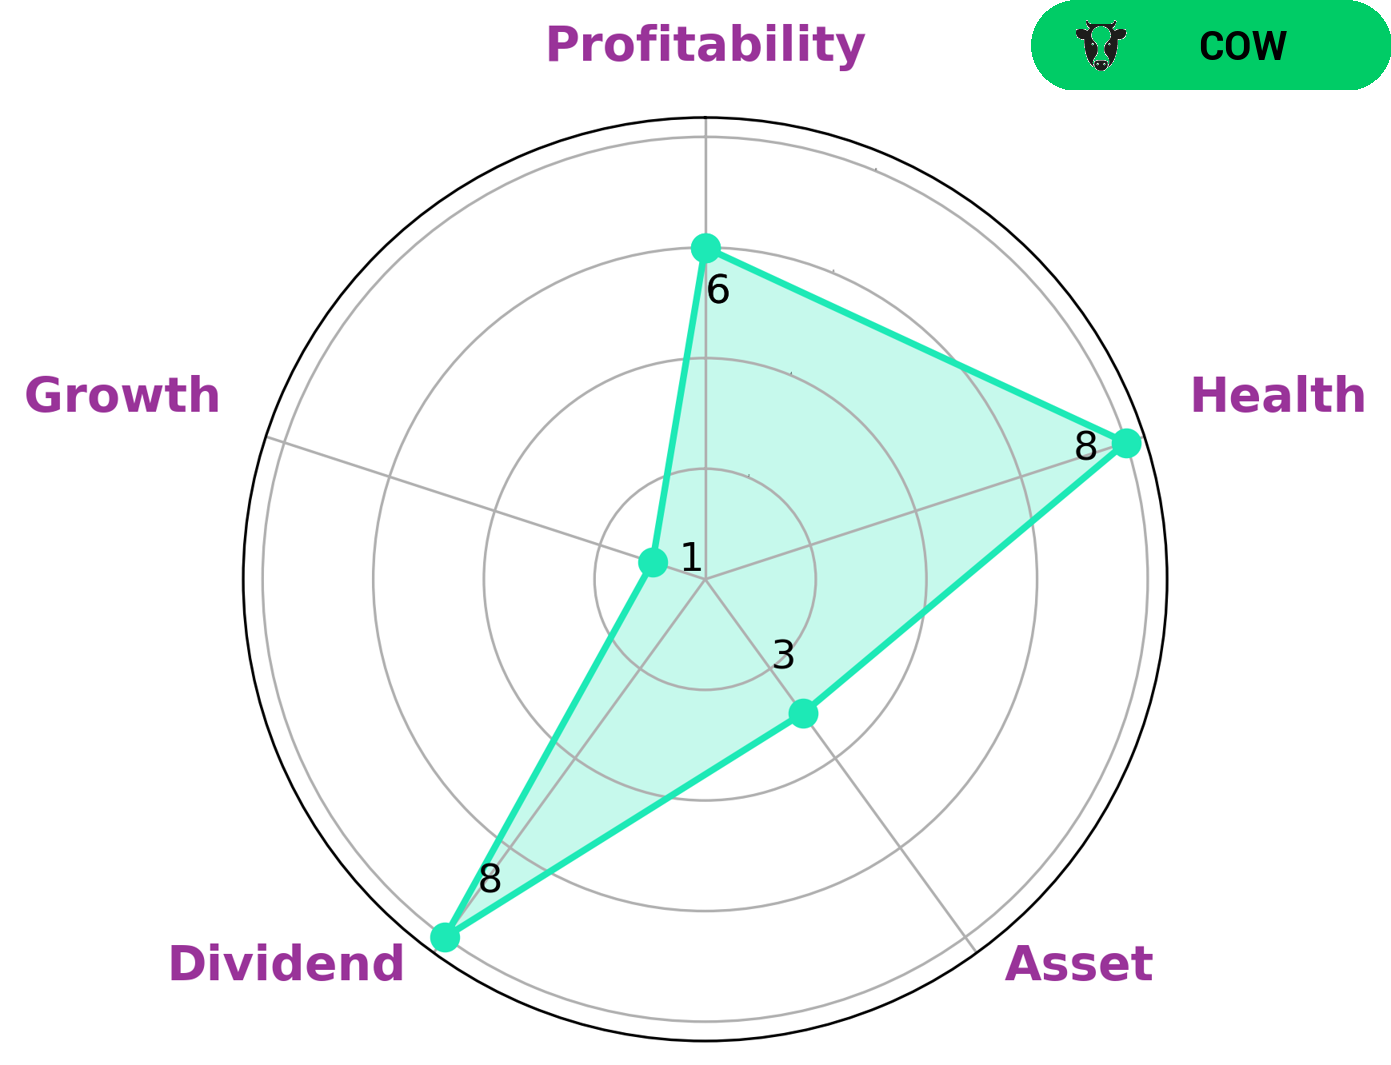
GoodWhale has conducted financial analysis on INVESCO LTD and the results have been extremely impressive. According to the Star Chart, INVESCO LTD has a high health score of 9/10 with regard to its cashflows and debt, indicating that the company is in a good position to sustain future operations in times of crisis. Furthermore, INVESCO LTD is classified as a ‘cow’, a type of company that we conclude has the track record of paying out consistent and sustainable dividends. This makes INVESCO LTD an ideal prospect for investors who are looking for a reliable dividend payer. Additionally, GoodWhale’s analysis also shows that INVESCO LTD is strong in dividend, profitability, and weak in asset and growth. This means that it is an attractive option for those who are looking for a solid return on their investment. All in all, INVESCO LTD is a great option for investors looking for strong returns in a reliable company. More…
Peers
The company operates in the US, Europe, and Asia Pacific. Invesco Ltd has a market capitalization of $15.48 billion as of March 2021. The company has a diversified product mix that includes mutual funds, ETFs, and separate accounts. Invesco Ltd’s primary competitors are Federated Hermes Inc, BlackRock Inc, and Janus Henderson Group PLC.
– Federated Hermes Inc ($NYSE:FHI)
Federated Hermes Inc has a market cap of 2.75B as of 2022. The company’s return on equity, a measure of how well it reinvested shareholder money, was 22.41%. Federated Hermes Inc is a financial services company that manages investments for a wide range of clients, including insurance companies, pension funds, and other institutional investors. The company offers a variety of investment strategies and products, including equities, fixed income, and alternative investments.
– BlackRock Inc ($NYSE:BLK)
BlackRock Inc is an American financial services company with a market cap of 86.29B as of 2022. It has a return on equity of 12.63%. The company was founded in 1988 and is headquartered in New York City. BlackRock operates as an investment management firm. It provides a range of investment, technology, and risk management solutions to institutional and retail clients worldwide. The company offers a variety of investment strategies, including active, passive, and alternative investments. BlackRock also provides technology solutions, risk management services, and portfolio construction and implementation services.
– Janus Henderson Group PLC ($NYSE:JHG)
As of 2022, Janus Henderson Group PLC has a market cap of 3.42B and a ROE of 7.52%. The company is a global asset management firm that offers a range of investment solutions, including equities, fixed income, alternatives, and multi-asset solutions.
Summary
Investors in Invesco Ltd. experienced a mixed reaction to the company’s financial results for the second quarter of FY2023. Total revenue was down by 5.7% compared to the same period last year, but net income rose 6.2%. The stock price responded negatively, falling on the same day. Overall, it appears that investors are uncertain about the company’s performance over the long term, and will need to keep an eye on future developments to make an informed decision about investing in Invesco.
Related Posts


Recent Posts


