Corebridge Financial dividend calculator – Corebridge Financial Inc Declares 0.23 Cash Dividend
March 22, 2023

Dividends Yield
On March 2 2023, Corebridge Financial ($BER:AS5) Inc declared that they will issue a 0.23 cash dividend to shareholders. This makes COREBRIDGE FINANCIAL an attractive option for those interested in dividend stocks. This company has consistently issued an annual dividend per share of 0.46 USD over the past 3 years, yielding an average of 2.27%.
This is a great way for investors to benefit from their holdings with Corebridge Financial Inc. The ex-dividend date for this stock is March 16 2023, so those who hold this stock or purchase it before this date will be eligible to receive the dividend. This is an exciting news for shareholders and potential investors alike, as this dividend is a great way to earn returns on their investments.
Stock Price
Furthermore, this dividend will further strengthen investor confidence in the future of the company and its ability to generate returns for shareholders. Live Quote…
About the Company
Income Snapshot
Below shows the total revenue, net income and net margin for Corebridge Financial. More…
| Total Revenues | Net Income | Net Margin |
| 26.68k | 8.15k | 30.5% |
Cash Flow Snapshot
Below shows the cash from operations, investing and financing for Corebridge Financial. More…
| Operations | Investing | Financing |
| 2.69k | -7.25k | 4.6k |
Balance Sheet Snapshot
Below shows the total assets, liabilities and book value per share for Corebridge Financial. More…
| Total Assets | Total Liabilities | Book Value Per Share |
| 364.22k | 355.07k | 12.73 |
Key Ratios Snapshot
Some of the financial key ratios for Corebridge Financial are shown below. More…
| 3Y Rev Growth | 3Y Operating Profit Growth | Operating Margin |
| 26.4% | – | 41.2% |
| FCF Margin | ROE | ROA |
| 10.1% | 87.3% | 1.9% |
Analysis
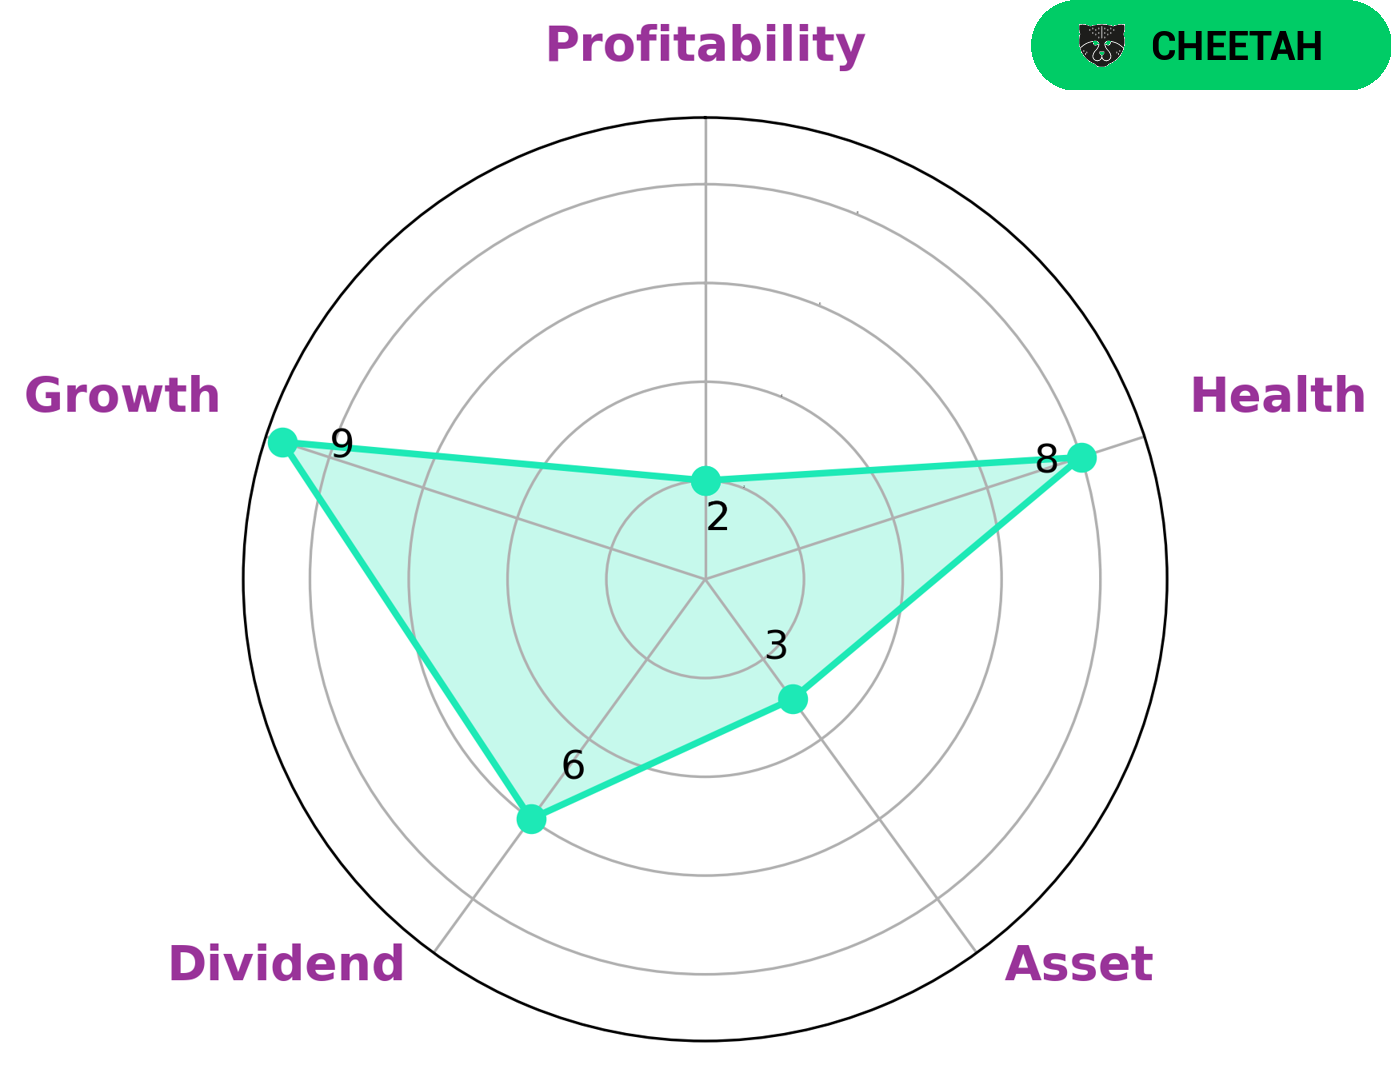
Our analysis of COREBRIDGE FINANCIAL‘s wellbeing reveals that the company is strong in growth, medium in dividend, and weak in asset and profitability. Through our Star Chart, we can classify COREBRIDGE FINANCIAL as a ‘cheetah’, a type of company that has achieved high revenue or earnings growth but is considered less stable due to lower profitability. Due to this, COREBRIDGE FINANCIAL may be of interest to certain kinds of investors. For example, those who are comfortable with taking on more risk may be drawn to this type of company, as it could potentially lead to higher returns in the long run. Fortunately, COREBRIDGE FINANCIAL has a high health score of 8/10, indicating that it is financially sound and capable of paying off debts and funding future operations. This should provide additional confidence to investors who are considering investing in COREBRIDGE FINANCIAL. More…
Summary
COREBRIDGE FINANCIAL is an attractive option for dividend investors to consider for their portfolio. Over the past three years, it has issued an average annual dividend per share of 0.46 USD, yielding an average of 2.27%. The company has a consistent dividend payout record, making it a reliable source of passive income. Given its fundamentals, investors can expect a healthy return on their investment over the long term.
Related Posts


Recent Posts


