LULULEMON ATHLETICA Reports Strong First Quarter Results for FY2024
June 12, 2023

☀️Earnings Overview
On June 1 2023, LULULEMON ATHLETICA ($NASDAQ:LULU) reported their results for the first quarter of FY2024, which concluded on April 30 2023. Total revenue surged 24.0% year-over-year to USD 2000.8 million, while net income climbed 52.8% to USD 290.4 million compared to the same quarter the year before.
Share Price
The company’s stock opened at $330.9 and closed at $328.4, down by 1.1% from last closing price of 331.9. The company reported an impressive growth in both revenue and profits on a year-over-year basis. LULULEMON ATHLETICA‘s strong financial performance was driven by a combination of factors, including an increase in demand for its products, expansion of its store network, and successful marketing campaigns. Moreover, the company also reported a notable increase in customer engagement and brand loyalty, which it believes will help it maintain its strong performance in the future. Ultimately, LULULEMON ATHLETICA has delivered positive results in the first quarter of FY2024, despite the challenging market conditions. Live Quote…
About the Company
Income Snapshot
Below shows the total revenue, net income and net margin for Lululemon Athletica. More…
| Total Revenues | Net Income | Net Margin |
| 8.5k | 955.21 | 14.3% |
Cash Flow Snapshot
Below shows the cash from operations, investing and financing for Lululemon Athletica. More…
| Operations | Investing | Financing |
| 1.26k | -606.83 | -323.33 |
Balance Sheet Snapshot
Below shows the total assets, liabilities and book value per share for Lululemon Athletica. More…
| Total Assets | Total Liabilities | Book Value Per Share |
| 5.57k | 2.25k | 26.08 |
Key Ratios Snapshot
Some of the financial key ratios for Lululemon Athletica are shown below. More…
| 3Y Rev Growth | 3Y Operating Profit Growth | Operating Margin |
| 30.2% | 33.0% | 22.0% |
| FCF Margin | ROE | ROA |
| 7.0% | 36.1% | 20.9% |
Analysis
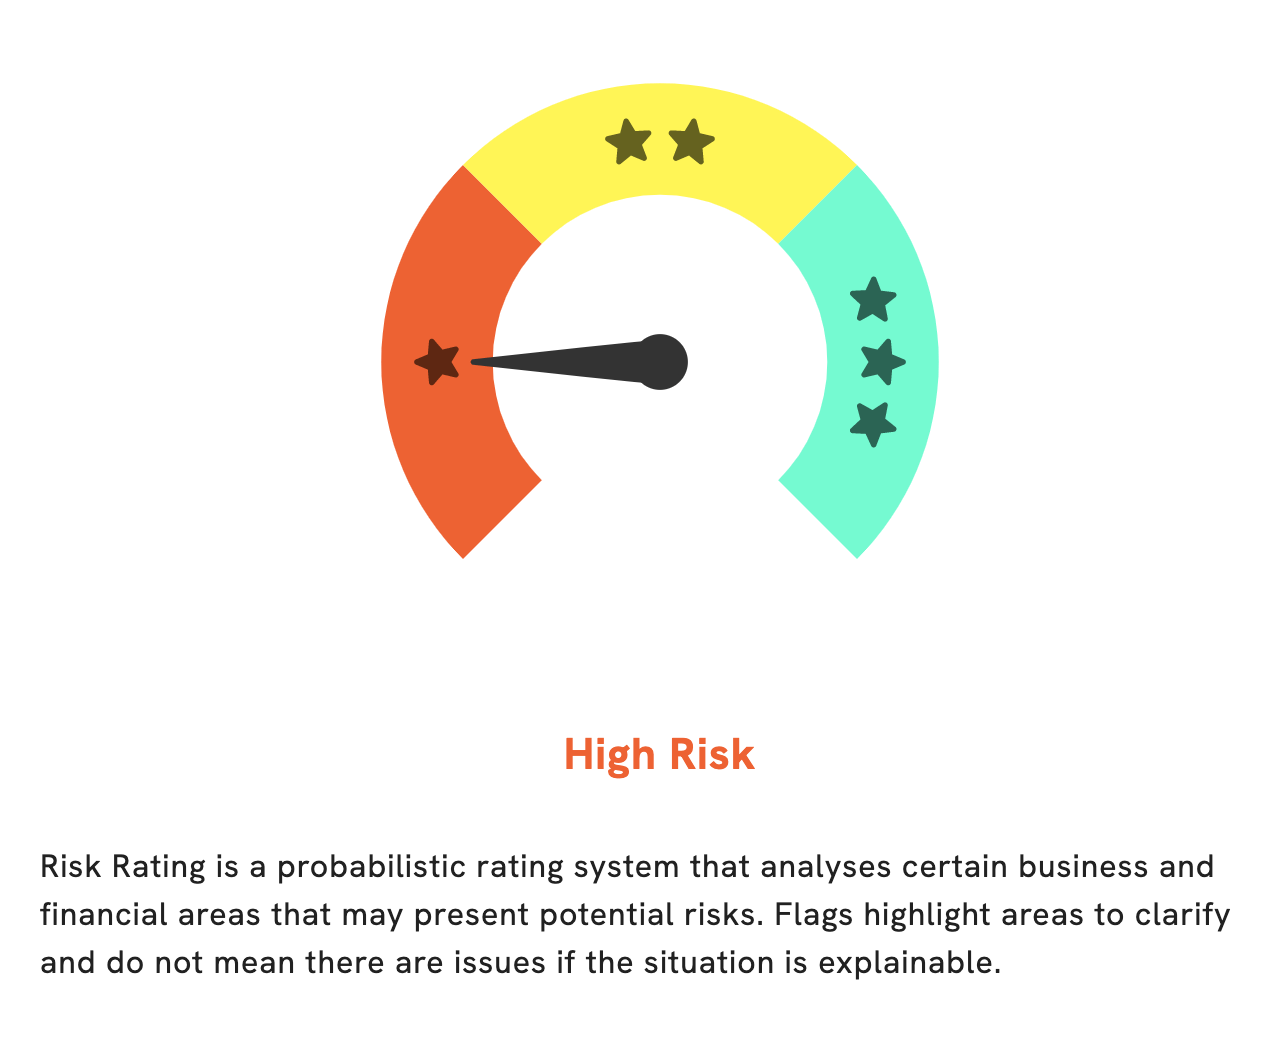
We at GoodWhale recently conducted an analysis of LULULEMON ATHLETICA‘s financials. After carefully examining the various financial and business aspects of the company, we have determined that it is a high risk investment. Specifically, our Risk Rating revealed three distinct risk warnings within LULULEMON ATHLETICA’s income sheet, balance sheet, and non financial statements. To gain access to the full analysis and to learn more about the potential risks associated with this company, become a registered user on our website. More…
Peers
Lululemon Athletica Inc is a yoga-inspired, technical athletic apparel company for women. The company operates in the United States, Canada, and Australia. Lululemon Athletica Inc’s main competitors are Buckle Inc, Citi Trends Inc, and Tilly’s Inc.
– Buckle Inc ($NYSE:BKE)
Buckle Inc is a leading retailer of casual apparel, footwear, and accessories for young men and women in the United States. As of 2022, the company has a market capitalization of 1.77 billion dollars and a return on equity of 55.65%. Buckle Inc operates over 450 stores in 44 states across the country, and offers its products through its website and catalog. The company’s mission is to provide great fashion at a great value for its customers.
– Citi Trends Inc ($NASDAQ:CTRN)
Citi Trends Inc is a value-priced retailer of urban fashion apparel, accessories and home décor. The company operates over 600 stores in 31 states. Citi Trends’ mission is to be the largest and most convenient source of trend-right fashion at the right price for our target demographic of urban youth.
– Tilly’s Inc ($NYSE:TLYS)
Tilly’s Inc is a company that operates in the retail industry. The company has a market cap of 239.38M as of 2022 and a return on equity of 19.35%. The company operates through two segments: stores and e-commerce. The company offers a variety of products including apparel, footwear, and accessories for men, women, and children. The company operates stores in California, Arizona, Nevada, and Texas.
Summary
Investors in LULULEMON ATHLETICA have reason to be optimistic, with the company posting impressive financial results for the first quarter of FY2024. Total revenue increased by 24.0% to USD 2000.8 million and net income rose by 52.8% to USD 290.4 million compared to the same quarter the previous year. This indicates strong consumer demand and positive financial performance, which could be a sign of more growth to come for the company. Investors should keep a close eye on LULULEMON ATHLETICA to take advantage of potential future gains.
Related Posts


Recent Posts


