CITI TRENDS Reports Third Quarter Earnings Results for FY2024
December 6, 2023

🌥️Earnings Overview
On November 28 2023, CITI TRENDS ($NASDAQ:CTRN) reported an overall 6.7% decrease in revenue for the third quarter of FY2024 (ending October 31 2023) to USD 179.5 million. Net income for the same period reportedly decreased to USD -3.9 million, when compared to the same quarter last year of USD 24.6 million.
Stock Price
The open price for CITI TRENDS stock was $21.6, and the closing price was $23.2. This marks a 12.0% plunge from the last closing price of $26.4. Analysts have speculated that the decrease in stock price could be due to a decrease in consumer spending related to the ongoing pandemic. Despite this decrease, CITI TRENDS is still ahead of the industry average in terms of stock performance over the last 12 months. CITI TRENDS has been able to remain profitable during these challenging times due to their focus on customer convenience. They have been successful in expanding their online presence and offering innovative products and services. They have also implemented a flexible pricing strategy which allows them to compete with other market leaders.
Additionally, a robust loyalty program has helped them retain existing customers and acquire new ones. This growth was driven by strong customer engagement, an increase in online sales, and a successful shift to digital operations. Overall, CITI TRENDS has been able to remain profitable in spite of lower overall sales due to its focus on customer convenience and digital operations. The company is confident that it will continue to grow in the coming quarters, despite the current economic headwinds. Live Quote…
About the Company
Income Snapshot
Below shows the total revenue, net income and net margin for Citi Trends. More…
| Total Revenues | Net Income | Net Margin |
| 742.22 | -8.89 | -1.2% |
Cash Flow Snapshot
Below shows the cash from operations, investing and financing for Citi Trends. More…
| Operations | Investing | Financing |
| 13.97 | 60.18 | -12.23 |
Balance Sheet Snapshot
Below shows the total assets, liabilities and book value per share for Citi Trends. More…
| Total Assets | Total Liabilities | Book Value Per Share |
| 508.21 | 355.15 | 18.21 |
Key Ratios Snapshot
Some of the financial key ratios for Citi Trends are shown below. More…
| 3Y Rev Growth | 3Y Operating Profit Growth | Operating Margin |
| -0.0% | -16.1% | -1.7% |
| FCF Margin | ROE | ROA |
| 0.4% | -4.9% | -1.5% |
Analysis
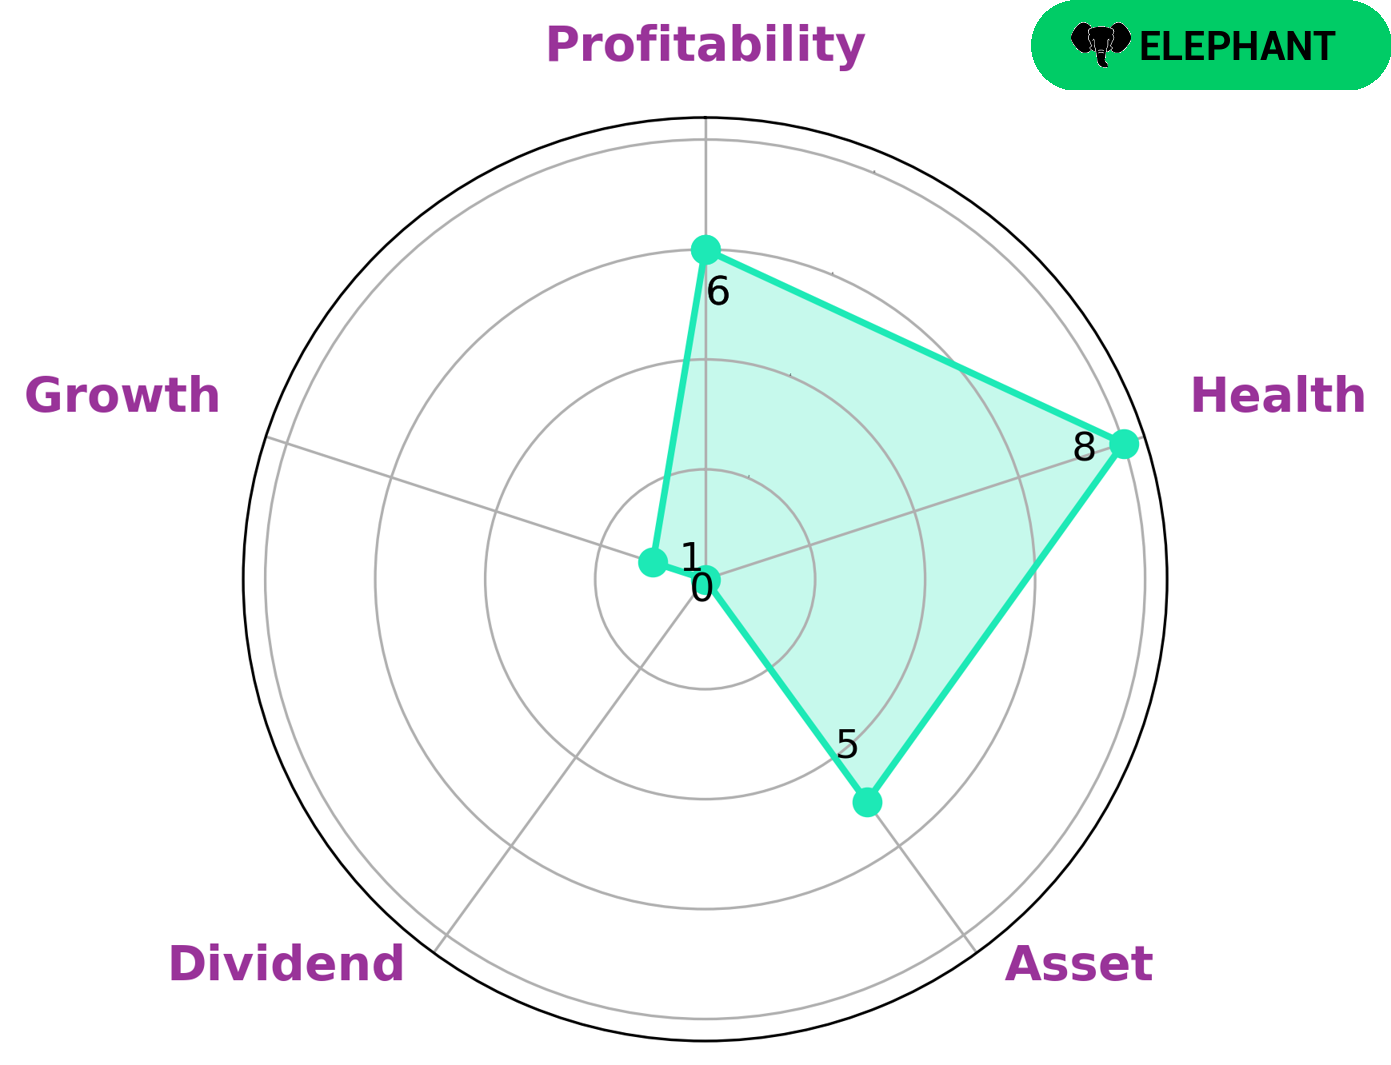
GoodWhale has conducted an analysis of CITI TRENDS‘s wellbeing. The Star Chart has classified CITI TRENDS as an ‘elephant’, which indicates that the company is rich in assets after liabilities have been deducted. This makes CITI TRENDS an attractive option for investors who are looking for a company with strong assets. In addition, CITI TRENDS is strong in medium assets, profitability and weak in dividend and growth. Moreover, its health score of 8/10 indicates that the company is capable of sustaining future operations in times of crisis. This reflects positively on the company’s cashflows and debt limit. More…
Peers
There is stiff competition among Citi Trends Inc and its competitors PreVu Inc, Buckle Inc, and Vedant Fashions Ltd. All four companies are vying for a share of the market for affordable trendy clothing. Citi Trends Inc has an advantage in that it has over 500 stores in 31 states, while its competitors have fewer stores. However, all four companies are comparable in terms of the quality of their clothing and the prices they charge.
– PreVu Inc ($OTCPK:PRVU)
PreVu Inc is a provider of marketing solutions. The company has a market cap of 159.57k as of 2022 and a return on equity of 20.12%. The company offers a variety of marketing services, including content marketing, social media marketing, and email marketing. The company also provides a variety of tools and resources to help businesses with their marketing needs.
– Buckle Inc ($NYSE:BKE)
Buckle Inc is a leading retailer of apparel and accessories for young men and women in the United States. The company has a market capitalization of 1.77 billion as of 2022 and a return on equity of 55.65%. Buckle Inc operates over 450 stores in 44 states under the Buckle, BKE, and MKL brand names. The company offers a wide variety of clothing, footwear, and accessories for both men and women. Buckle Inc has a strong online presence and offers free shipping on orders over $100. The company is headquartered in Kearney, Nebraska.
– Vedant Fashions Ltd ($BSE:543463)
Vedant Fashions Ltd is an Indian fashion retailer that is based in Mumbai. The company has a market cap of 340.01B as of 2022 and a Return on Equity of 38.43%. The company was founded in 1984 and operates a chain of stores across India. It offers a wide range of products such as clothing, accessories, and home furnishings. The company also has an online store that ships to various international locations.
Summary
Investors in CITI TRENDS should be cautious following the company’s third quarter FY2024 earnings report, where total revenues decreased by 6.7% and net income was reported at a loss of -3.9 million. This is a stark contrast to the same quarter last year, which saw total revenues of USD 179.5 million and net income of USD 24.6 million. Given the significant drop in both revenue and net income, investors should proceed with caution and conduct thorough research before making an investment in CITI TRENDS.
Related Posts


Recent Posts


