Citi Trends Intrinsic Stock Value – CITI TRENDS Reports Q3 FY2024 Earnings Results for November 28, 2023
December 13, 2023

🌥️Earnings Overview
On October 31, 2023, CITI TRENDS ($NASDAQ:CTRN) released their financial results for the third quarter of FY2024 ending November 28, 2023. The company reported total revenue of USD 179.5 million, a 6.7% decrease from the same quarter last year. Net income for the quarter was reported to be USD -3.9 million, in comparison to 24.6 million from the same period in the prior year.
Stock Price
The company’s stock opened the day at $21.6 and closed at $23.2, a 12.0% plunge from the prior closing price of $26.4. This significant decrease in share price was likely driven by a combination of factors, including macroeconomic trends, the performance of the company’s core business, and external pressures such as the competitive landscape. It is likely that investors’ sentiment was impacted by the losses posted by CITI TRENDS during the quarter, which may have been exacerbated by unfavorable macroeconomic forces.
Furthermore, the company’s performance was probably challenged by external factors as well, such as increased competition or a saturated market. The stock’s drastic decline further reflects this sentiment and may indicate a need for the company to reassess its strategies and operations moving forward. Live Quote…
About the Company
Income Snapshot
Below shows the total revenue, net income and net margin for Citi Trends. More…
| Total Revenues | Net Income | Net Margin |
| 742.22 | -8.89 | -1.2% |
Cash Flow Snapshot
Below shows the cash from operations, investing and financing for Citi Trends. More…
| Operations | Investing | Financing |
| 13.97 | 60.18 | -12.23 |
Balance Sheet Snapshot
Below shows the total assets, liabilities and book value per share for Citi Trends. More…
| Total Assets | Total Liabilities | Book Value Per Share |
| 508.21 | 355.15 | 18.21 |
Key Ratios Snapshot
Some of the financial key ratios for Citi Trends are shown below. More…
| 3Y Rev Growth | 3Y Operating Profit Growth | Operating Margin |
| -0.0% | -16.1% | -1.7% |
| FCF Margin | ROE | ROA |
| 0.4% | -4.9% | -1.5% |
Analysis – Citi Trends Intrinsic Stock Value
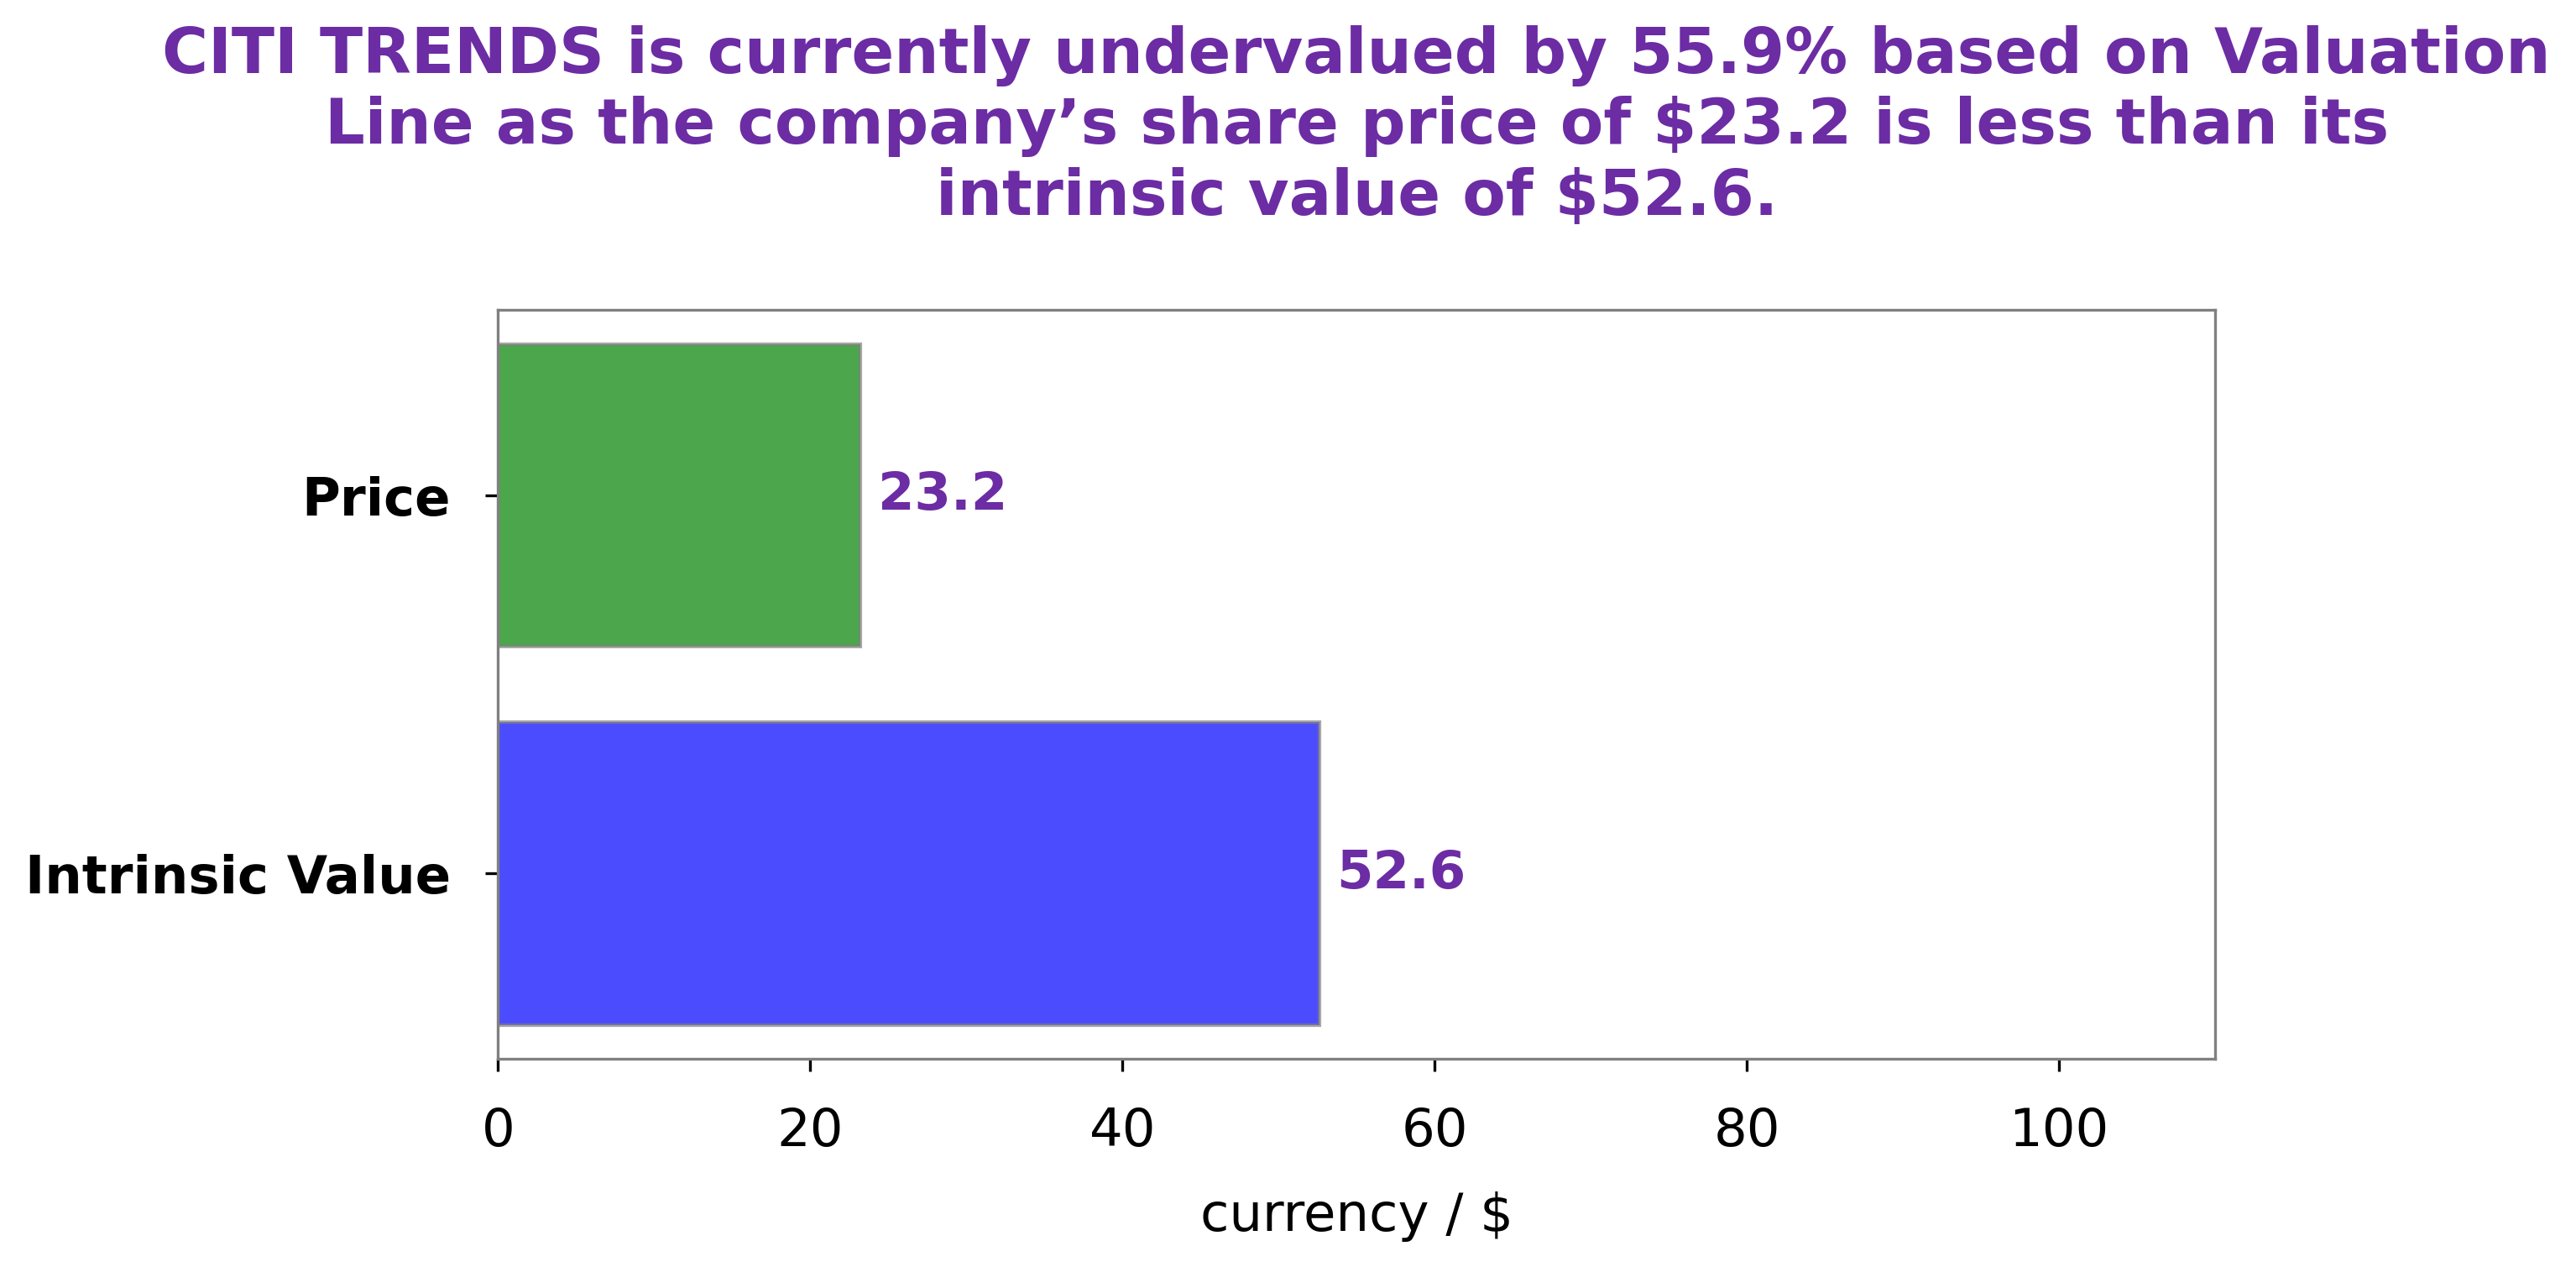
GoodWhale has analyzed CITI TRENDS‘ financials to determine its fair value. After our proprietary Valuation Line was applied, we determined the fair value of CITI TRENDS share to be around $52.6. However, currently the stock is trading at $23.2, which is undervalued by 55.9%. This presents an opportunity for investors to buy CITI TRENDS’ stock at a discounted rate. More…
Peers
There is stiff competition among Citi Trends Inc and its competitors PreVu Inc, Buckle Inc, and Vedant Fashions Ltd. All four companies are vying for a share of the market for affordable trendy clothing. Citi Trends Inc has an advantage in that it has over 500 stores in 31 states, while its competitors have fewer stores. However, all four companies are comparable in terms of the quality of their clothing and the prices they charge.
– PreVu Inc ($OTCPK:PRVU)
PreVu Inc is a provider of marketing solutions. The company has a market cap of 159.57k as of 2022 and a return on equity of 20.12%. The company offers a variety of marketing services, including content marketing, social media marketing, and email marketing. The company also provides a variety of tools and resources to help businesses with their marketing needs.
– Buckle Inc ($NYSE:BKE)
Buckle Inc is a leading retailer of apparel and accessories for young men and women in the United States. The company has a market capitalization of 1.77 billion as of 2022 and a return on equity of 55.65%. Buckle Inc operates over 450 stores in 44 states under the Buckle, BKE, and MKL brand names. The company offers a wide variety of clothing, footwear, and accessories for both men and women. Buckle Inc has a strong online presence and offers free shipping on orders over $100. The company is headquartered in Kearney, Nebraska.
– Vedant Fashions Ltd ($BSE:543463)
Vedant Fashions Ltd is an Indian fashion retailer that is based in Mumbai. The company has a market cap of 340.01B as of 2022 and a Return on Equity of 38.43%. The company was founded in 1984 and operates a chain of stores across India. It offers a wide range of products such as clothing, accessories, and home furnishings. The company also has an online store that ships to various international locations.
Summary
Investors in CITI TRENDS may be disappointed with the company’s earnings report for the third quarter of FY2024 ending November 28 2023. Total revenue for the quarter was USD 179.5 million, a 6.7% decrease from the same period last year, and net income reported was USD -3.9 million, compared to 24.6 million in the same period the year before. This was reflected in the stock price, which dropped on the same day. Investors should watch CITI TRENDS closely in the coming quarters to assess whether the company is able to improve its performance and return to profitability.


