Buckle’s Lack of Growth Stifles Share Price
December 31, 2023

☀️Trending News
The Buckle ($NYSE:BKE), Inc., a specialty clothing retailer, has seen its share price suffer due to its lack of growth. This limited geographical reach has left The Buckle with hindered profits and limited potential for growth.
Additionally, the company’s inability to diversify its product assortment has also limited its potential. The Buckle is largely known for its jeans and casual apparel, resulting in its failure to capitalize on other apparel categories. Its limited product variety has made it difficult for the company to attract new customers, further limiting its potential for growth. While The Buckle remains a profitable company with loyal customers, its lack of expansion has significantly impacted its stock price. The company’s inability to expand into new markets or diversify its product offering has ultimately prevented it from reaching its full potential, leading to a stagnated share price.
Market Price
BUCKLE’s stock market performance on Tuesday was lacklustre, with the stock opening at $47.2 and closing at $47.4, up by 1.3% from the prior closing price of $46.8. This lackluster performance reflects the company’s failure to achieve any meaningful growth in its share price over the past several months. Despite numerous efforts to increase market share and attract new investors, BUCKLE’s share price has remained largely stagnant and has failed to gain any meaningful traction. As a result, BUCKLE’s stock is quickly becoming a less viable investment option for many investors. Buckles_Lack_of_Growth_Stifles_Share_Price”>Live Quote…
About the Company
Income Snapshot
Below shows the total revenue, net income and net margin for Buckle. More…
| Total Revenues | Net Income | Net Margin |
| 1.28k | 228.18 | 17.8% |
Cash Flow Snapshot
Below shows the cash from operations, investing and financing for Buckle. More…
| Operations | Investing | Financing |
| 254.39 | -41.4 | -202.88 |
Balance Sheet Snapshot
Below shows the total assets, liabilities and book value per share for Buckle. More…
| Total Assets | Total Liabilities | Book Value Per Share |
| 921.21 | 447.19 | 9.4 |
Key Ratios Snapshot
Some of the financial key ratios for Buckle are shown below. More…
| 3Y Rev Growth | 3Y Operating Profit Growth | Operating Margin |
| 14.5% | 25.7% | 22.2% |
| FCF Margin | ROE | ROA |
| 17.3% | 39.1% | 19.3% |
Analysis
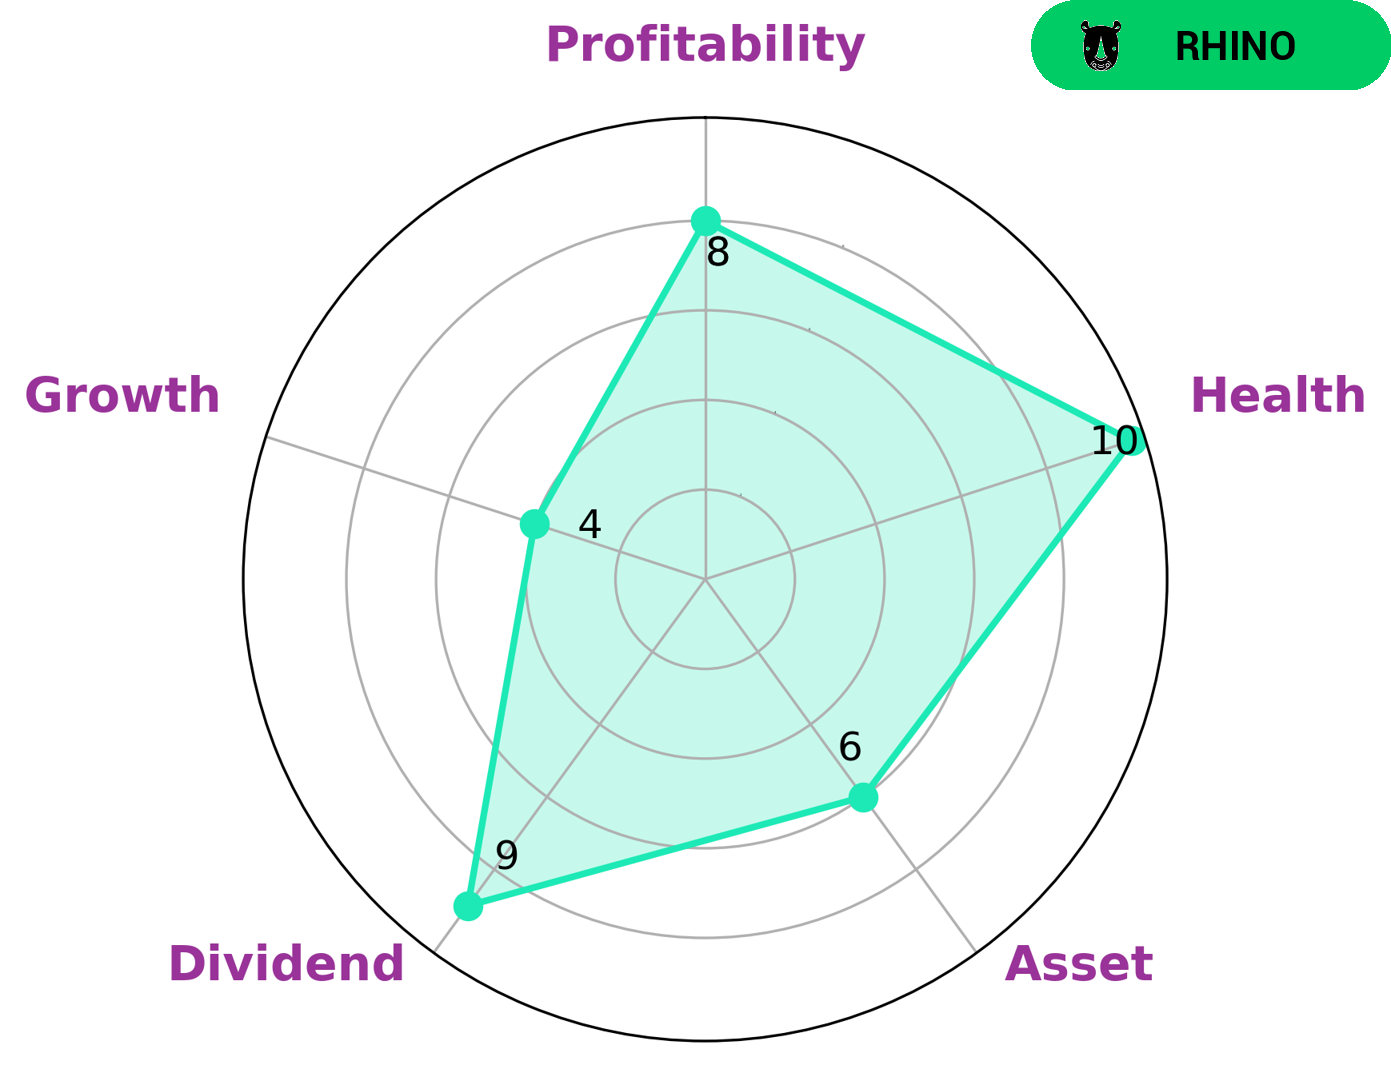
As GoodWhale, we conducted an analysis of BUCKLE’s wellbeing. According to the Star Chart, BUCKLE is classified as ‘rhino’, a type of company that has achieved moderate revenue or earnings growth. Investors looking for steady returns may be interested in such a company. BUCKLE has a high health score of 10/10 with regard to its cashflows and debt, indicating that it is capable to sustain future operations in times of crisis. Additionally, we found that BUCKLE is strong in dividend, profitability, and medium in asset growth. This suggests that the company is well-positioned to make strategic decisions and maintain profitability in the future. Buckles_Lack_of_Growth_Stifles_Share_Price”>More…
Peers
Buckle Inc. is an American fashion retailer that specializes in selling apparel, footwear, and accessories for men and women. The company operates through two segments: Retail and Direct. The Retail segment consists of the company’s stores, e-commerce, and catalog businesses. The Direct segment includes the company’s credit card business. Buckle Inc. competes with Citi Trends Inc, Vedant Fashions Ltd, Gfoot Co Ltd, and other retailers who sell similar products.
– Citi Trends Inc ($NASDAQ:CTRN)
Citi Trends Inc is a specialty retailer of urban lifestyle apparel and accessories for men, women, and children. The company has a market cap of 183.43M and a ROE of 27.52%. Citi Trends operates over 700 stores in 33 states, primarily in the southeastern United States. The company offers a variety of apparel, including t-shirts, hoodies, jeans, and dresses, as well as accessories such as jewelry, belts, and handbags. Citi Trends’ mission is to provide affordable, trendy apparel and accessories for its customers.
– Vedant Fashions Ltd ($BSE:543463)
Vedant Fashions Ltd is an Indian clothing company with a market cap of 347.93B as of 2022. The company has a Return on Equity of 38.43%. Vedant Fashions Ltd is a leading manufacturer and retailer of clothing in India. The company designs, manufactures, and markets a wide range of clothing products for men, women, and children. Vedant Fashions Ltd has a wide network of retail outlets across India. The company also has an online presence through its website and mobile app.
– Gfoot Co Ltd ($TSE:2686)
Gfoot Co Ltd is a company that manufactures and sells footwear. It has a market cap of 12.42B as of 2022 and a Return on Equity of -375.46%. The company’s products are sold in over 100 countries and it has over 30,000 employees.
Summary
Investors have been concerned with the recent performance of The Buckle, Inc. (NYSE: BKE), as share prices have decreased and growth has been insufficient. This has led to The Buckle Inc. being rated as a ‘Hold’ on the stock market, and investors are advised to be cautious of the company’s uncertain future. Investors should continue to watch the stock market for further updates on The Buckle, Inc. to decide whether or not it is a viable investment opportunity.
Related Posts


Recent Posts


