Boot Barn Reports $1.53 GAAP EPS, Revenue of $425.7M Misses Expectations
May 18, 2023

Trending News 🌧️
Boot Barn ($NYSE:BOOT), a leading lifestyle retailer of boots, apparel, and accessories, recently reported a GAAP EPS of $1.53, exceeding expectations by $0.10.
However, revenue of $425.7M came in lower than projections by $15.3M. Despite the lower-than-expected revenue figures, investors remain optimistic about the potential of Boot Barn’s business model and believe that the company can continue to grow in the coming quarters. Overall, the recent earnings report suggests that Boot Barn is making progress in its efforts to expand its customer base and drive long-term profitability. The company’s management team is committed to delivering value to shareholders while maintaining its commitment to providing customers with quality products and excellent service.
Price History
The company’s stock opened at $72.5 and closed at $74.8, a 4.0% increase from their prior closing price of $71.9. These numbers indicate that the stock market is confident about the company’s future earnings despite the small miss on revenue. Live Quote…
About the Company
Income Snapshot
Below shows the total revenue, net income and net margin for Boot Barn. More…
| Total Revenues | Net Income | Net Margin |
| 1.62k | 168.86 | 10.5% |
Cash Flow Snapshot
Below shows the cash from operations, investing and financing for Boot Barn. More…
| Operations | Investing | Financing |
| -14.64 | -103.75 | 54.07 |
Balance Sheet Snapshot
Below shows the total assets, liabilities and book value per share for Boot Barn. More…
| Total Assets | Total Liabilities | Book Value Per Share |
| 1.51k | 783.24 | 24.46 |
Key Ratios Snapshot
Some of the financial key ratios for Boot Barn are shown below. More…
| 3Y Rev Growth | 3Y Operating Profit Growth | Operating Margin |
| 23.9% | 42.2% | 14.3% |
| FCF Margin | ROE | ROA |
| -7.3% | 20.6% | 9.6% |
Analysis
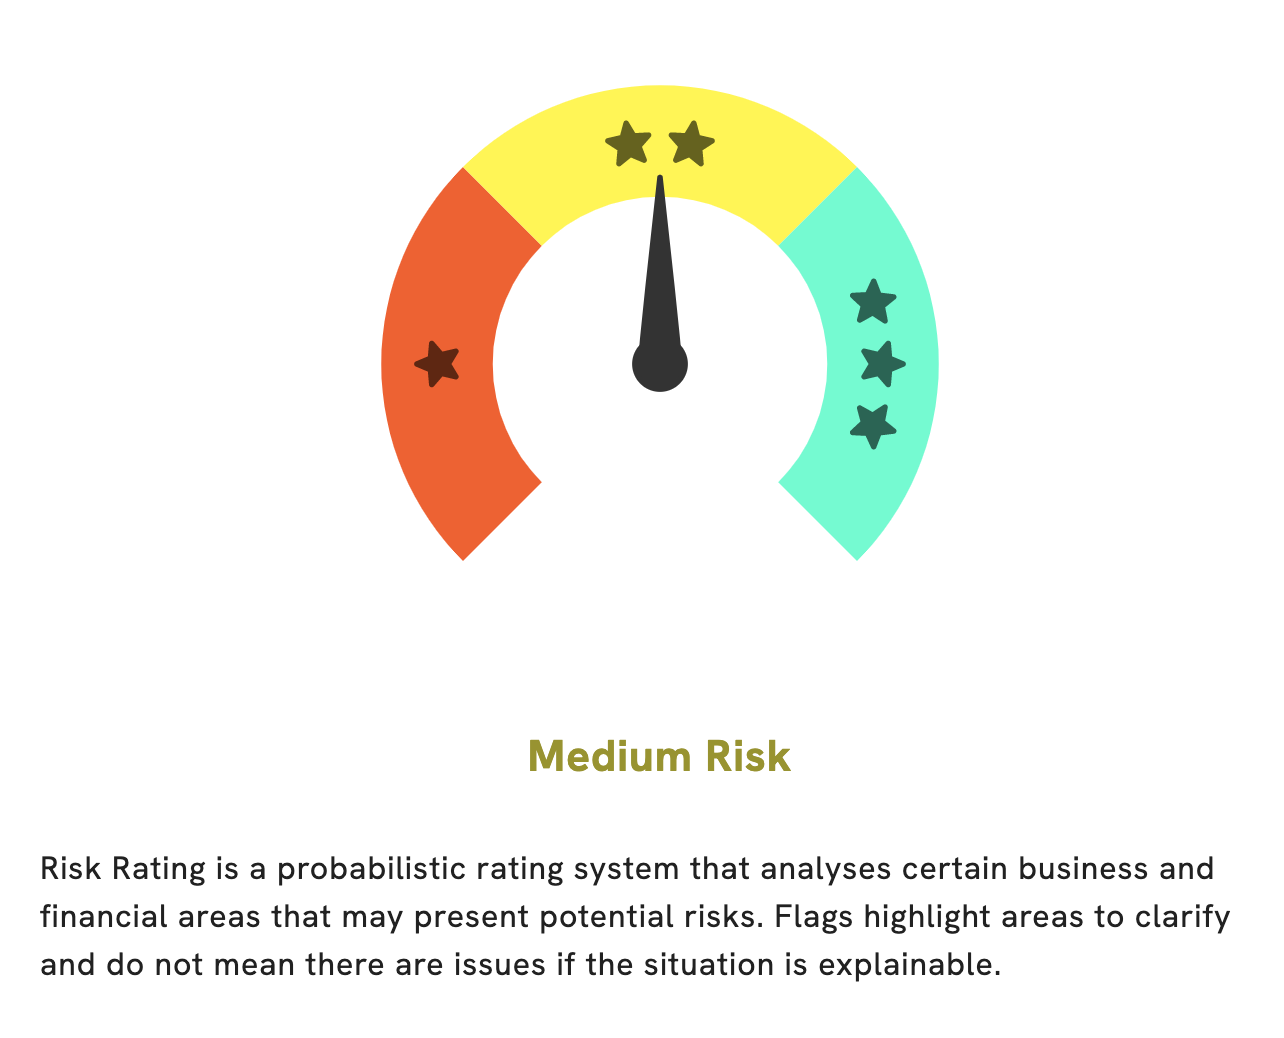
At GoodWhale, we recently conducted an analysis of BOOT BARN‘s welfare by evaluating their financial and business aspects. After careful consideration, our Risk Rating placed BOOT BARN at a medium risk level. While BOOT BARN has exhibited strong financial health, there are certain risk warnings that we have detected in their income sheet, balance sheet, and non-financial areas. Register with us to learn more about these warnings and how they might affect your investment. More…
Peers
The competition in the retail sector is fierce, with companies vying for market share in a number of ways. Boot Barn Holdings Inc is no exception, and competes against Christopher & Banks Corp, C’sMEN Co Ltd, and J.Jill Inc in a number of ways. While each company has its own strengths and weaknesses, the competition between them is intense, and the battle for market share is likely to continue.
– Christopher & Banks Corp ($OTCPK:CBKCQ)
Christopher & Banks Corporation is a Minnesota-based retailer of women’s apparel, accessories and footwear. The company operates under the Christopher & Banks, CJ Banks, and Missy & Plus names. It also offers merchandise through its e-commerce website and through a nationwide network of outlet stores. As of February 3, 2018, the company operated 942 stores in 44 states.
– C’sMEN Co Ltd ($TSE:3083)
MEN Co Ltd is a Japanese company that manufactures and sells electronic components. The company has a market cap of 1.52B as of 2022 and a Return on Equity of -12.39%. The company’s products include semiconductors, integrated circuits, and other electronic components.
– J.Jill Inc ($NYSE:JILL)
J.Jill Inc is a retailer of women’s apparel, accessories, and footwear. It operates through two segments, Retail and Direct. The company offers its products through retail stores, catalogs, and online. As of 2022, J.Jill Inc had a market cap of 186.02M and a Return on Equity of -233.39%. The company has been struggling in recent years, as evidenced by its negative ROE. J.Jill Inc is currently in the process of closing some of its stores in an effort to turn things around.
Summary
Despite the miss on revenue, the stock price moved up the same day due to the better-than-expected EPS result. Investors should focus on the company’s ability to cut costs and increase efficiency to drive margin expansion going forward. Analysts will also be looking at future revenue growth potential, competitive environment and ability to attract new customers, as well as management’s plans for capital allocation and cost optimization. With the stock currently trading near its all-time highs, investors should be mindful of valuation and any potential headwinds that could affect the company’s future performance.
Related Posts


Recent Posts


