ANF Intrinsic Value Calculation – Executives of Abercrombie & Fitch Cash Out with $1.7 Million Stock Sale
November 30, 2023

🌥️Trending News
Abercrombie & Fitch ($NYSE:ANF), a clothing retailer that has been around for more than a century, has recently seen its executives cash out with a $1.7 million stock sale. The company is well-known for its young adult fashion and is listed on the New York Stock Exchange. This sizable transaction by the executives was likely done for tax reasons or to diversify their portfolios.
The company has seen a resurgence in popularity in recent years, and it has been able to weather the pandemic better than most retailers thanks to its online presence. With more people gravitating towards comfier and more casual clothing styles due to the pandemic, Abercrombie & Fitch is well-positioned to capitalize on this trend and continue to grow in the future.
Market Price
The stock opened at $76.1 and closed at $77.7, up by 1.7% from its previous closing price of 76.4. This was a great opportunity for the executives to cash out and take advantage of the stock’s rise in value. It is also a sign that the company is performing well and investors have confidence in the business. It remains to be seen if the stock will continue to rise or if it will drop back down again in the coming days and weeks. Live Quote…
About the Company
Income Snapshot
Below shows the total revenue, net income and net margin for ANF. More…
| Total Revenues | Net Income | Net Margin |
| 4.03k | 208.01 | 5.3% |
Cash Flow Snapshot
Below shows the cash from operations, investing and financing for ANF. More…
| Operations | Investing | Financing |
| 648.99 | -172.27 | -87.53 |
Balance Sheet Snapshot
Below shows the total assets, liabilities and book value per share for ANF. More…
| Total Assets | Total Liabilities | Book Value Per Share |
| 2.9k | 2.02k | 17.18 |
Key Ratios Snapshot
Some of the financial key ratios for ANF are shown below. More…
| 3Y Rev Growth | 3Y Operating Profit Growth | Operating Margin |
| 8.1% | 6.1% | 8.7% |
| FCF Margin | ROE | ROA |
| 11.8% | 26.9% | 7.6% |
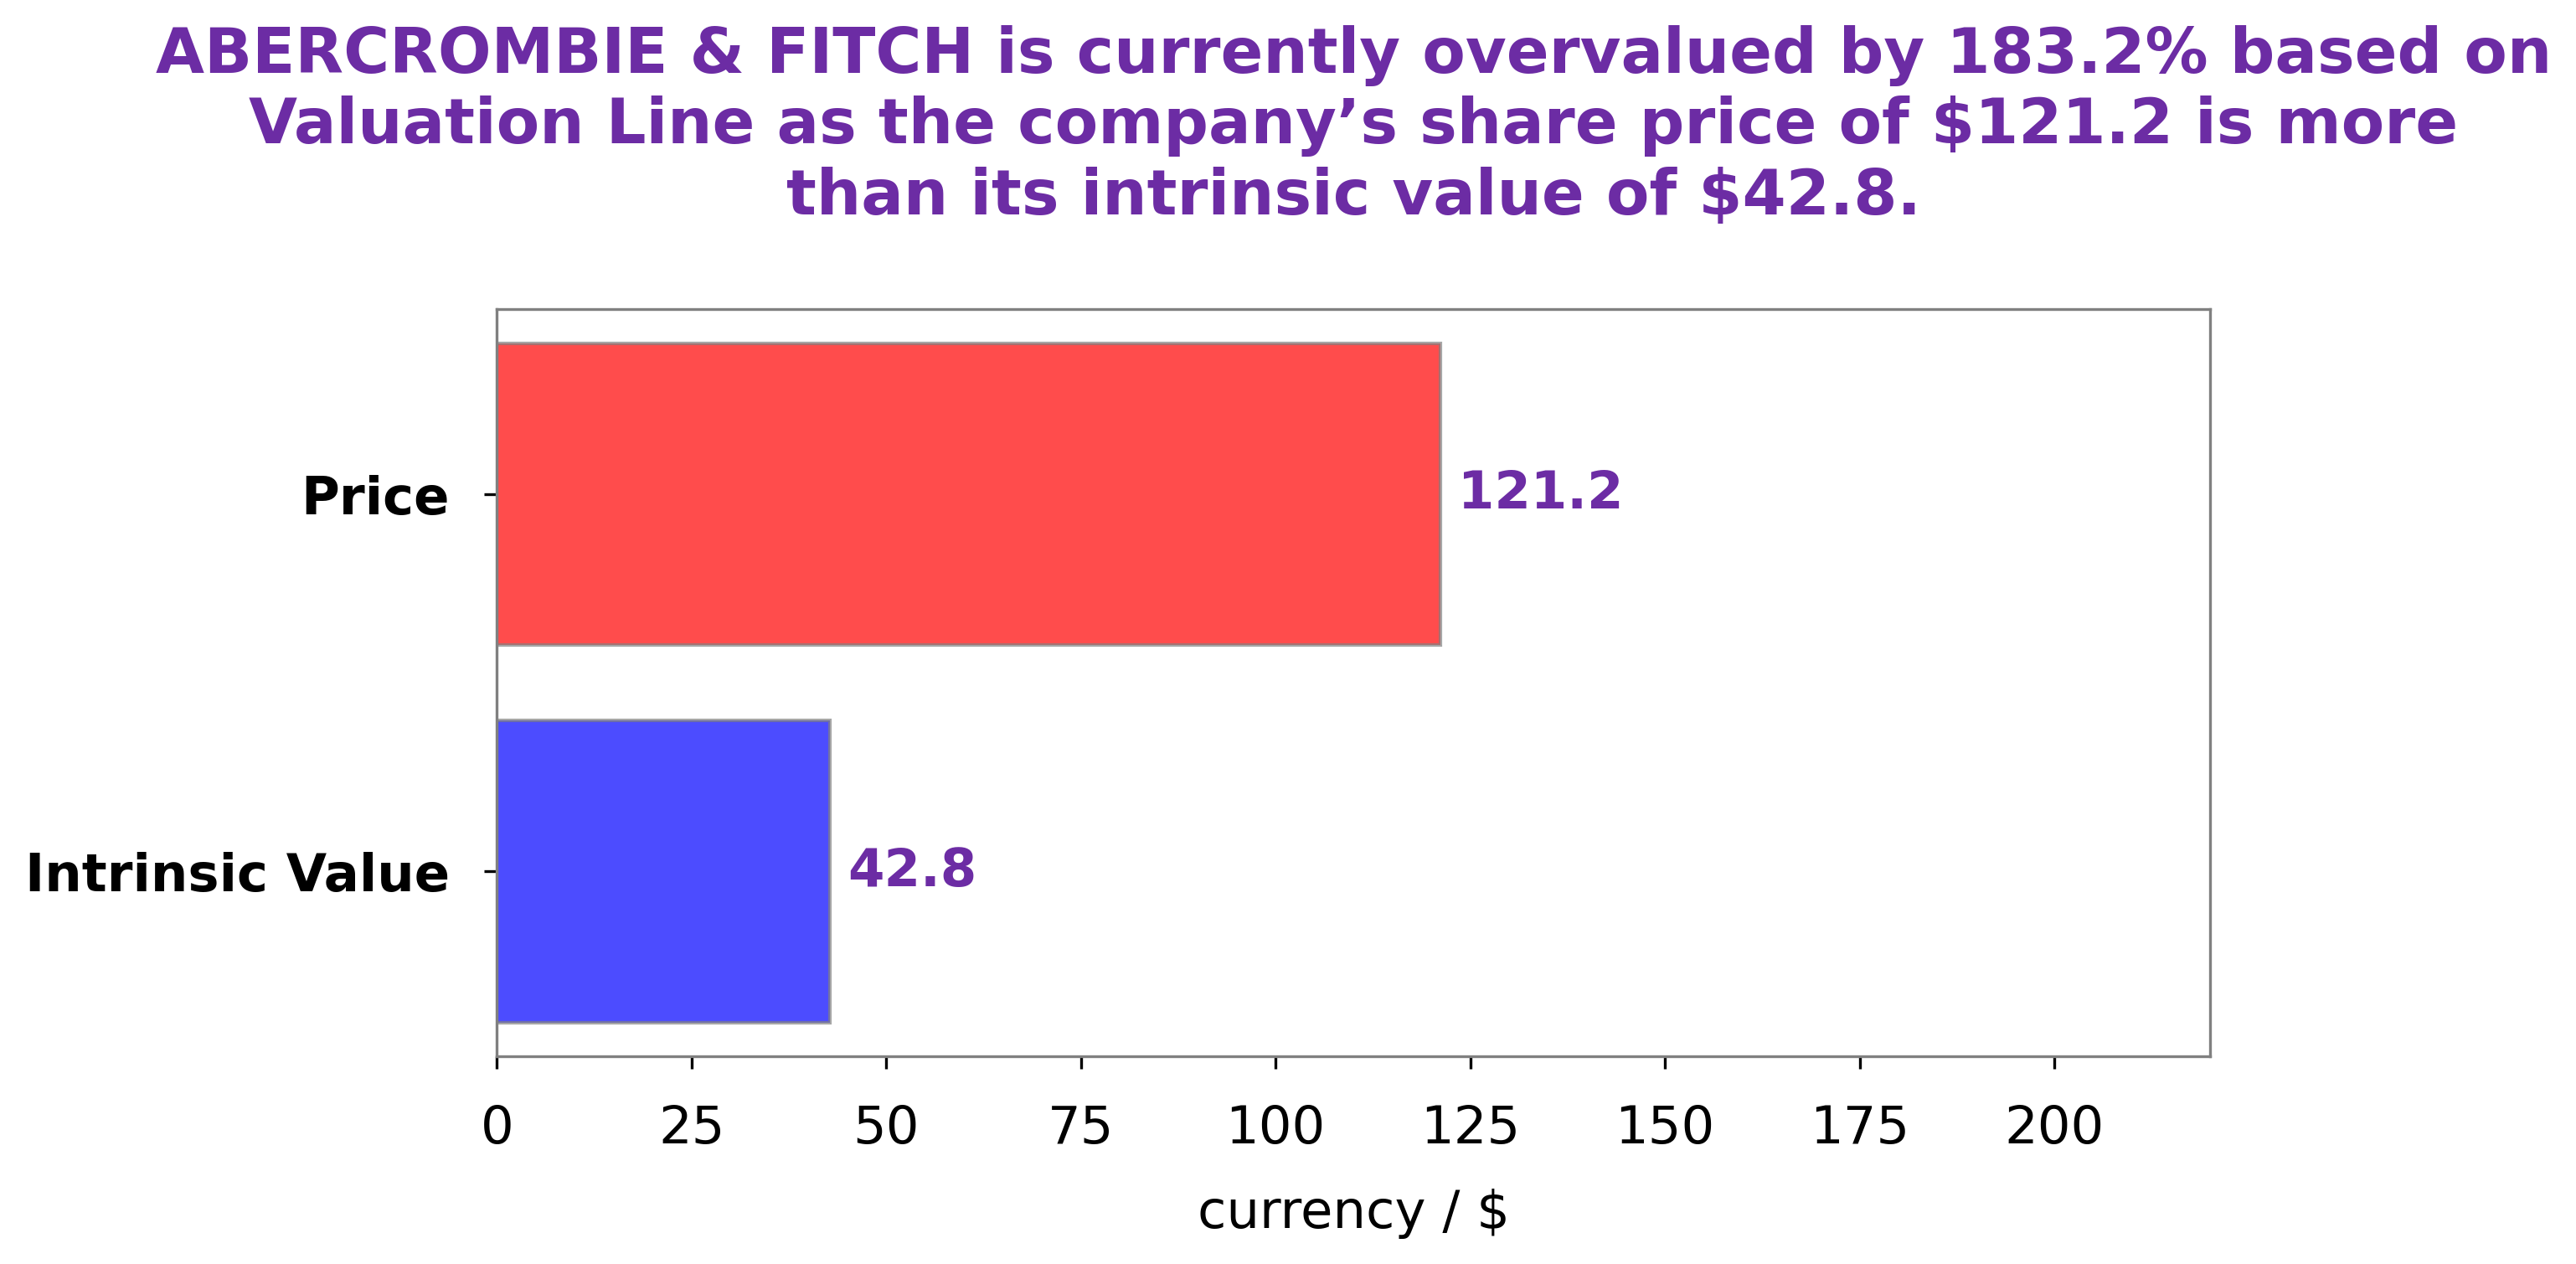
Analysis – ANF Intrinsic Value Calculation
At GoodWhale, we conducted an analysis of ABERCROMBIE & FITCH’s wellbeing. With our proprietary Valuation Line, we were able to calculate the intrinsic value of ABERCROMBIE & FITCH’s share at around $37.4. However, currently ABERCROMBIE & FITCH’s stock is being traded at $77.7, significantly higher than its intrinsic value. This means the stock is overvalued by 107.9%. More…
Peers
Competition between Abercrombie & Fitch Co and its competitors, Gap Inc, Children’s Place Inc, and Ross Stores Inc, is fierce. All four companies specialize in retail apparel and strive to offer their customers the best products and services. As a result, each company constantly works to outpace the others in terms of product offerings, store locations, and customer service.
– Gap Inc ($NYSE:GPS)
Gap Inc is a leading apparel retail company based in San Francisco, California. The company offers apparel, accessories, and personal care products for men, women, and children through its brands, which include Gap, Old Navy, Banana Republic, Athleta, and Intermix. As of 2022, Gap Inc. has a market capitalization of 4.4 billion dollars and a return on equity of -0.62%. This is lower than the industry average for apparel retail companies, indicating that the company has not been able to generate a satisfactory return on its equity investments. However, the company’s market capitalization of 4.4 billion dollars suggests that investors are still confident in the company’s future prospects.
– Children’s Place Inc ($NASDAQ:PLCE)
Children’s Place Inc is a popular children’s apparel retailer with a market cap of 461.48M as of 2022. The company offers a variety of clothing, accessories, and footwear for kids ranging from newborn to age 14. They have an impressive Return on Equity of 41.18%, which is a measure of the company’s ability to generate income from shareholders’ investments. This is a strong indicator of the company’s financial health and its ability to make efficient use of capital. The Children’s Place Inc is well-positioned to continue to provide great products and services to its customers in the years to come.
– Ross Stores Inc ($NASDAQ:ROST)
Ross Stores Inc is a leading off-price retailer in the United States. It operates 1,400 stores in 39 states, the District of Columbia, and Guam. The company offers apparel, accessories, footwear, and home fashions at discounts of 20% to 60% below department and specialty store regular prices. As of 2022, Ross Stores Inc has a market capitalization of 39.77B and a Return on Equity (ROE) of 29.12%. This reflects the company’s strong financial performance and ability to generate significant returns for its shareholders. Ross Stores has consistently recorded positive earnings growth for over 10 years and is well positioned for future growth.
Summary
Abercrombie & Fitch recently filed SEC documents revealing that executives of the company sold over $1.7 million worth of their stock. This indicates that those in positions of power do not have a strong faith in the company’s performance in the near future. Investors should consider this when they make decisions about investing in the company, as it may be a sign of potential short-term losses. Other indicators such as financials, analyst ratings, and customer sentiment should also be taken into account before investing.


