TEXTRON INC Reports 2nd Quarter Earnings Results for FY2023 on July 27, 2023
August 27, 2023

🌥️Earnings Overview
On July 27 2023, TEXTRON INC ($NYSE:TXT) reported their financial results for the 2nd quarter of FY2023 ending June 30 2023. Total revenue surged to USD 6448.0 million, a 104.4% increase from the year before, while net income jumped 109.2% to USD 454.0 million compared to the same quarter of the previous year.
Market Price
The stock opened at $72.5 and closed at $76.5 on the day, soaring by 11.9% from its prior closing price of 68.4. This is a reflection of the company’s success in streamlining its operations and increasing efficiency across all divisions. Moreover, TEXTRON INC has made significant investments in research and development, resulting in the launch of several new products that are being well-received by customers. TEXTRON INC has also been focusing on expanding its global presence and strengthening its foothold in emerging markets.
Overall, TEXTRON INC’s second quarter earnings results demonstrate its strong financial performance and potential for growth in the near future. The company is well-positioned to capitalize on the opportunities presented by a growing global economy and is continuing to take strategic steps to ensure long-term success. Live Quote…
About the Company
Income Snapshot
Below shows the total revenue, net income and net margin for Textron Inc. More…
| Total Revenues | Net Income | Net Margin |
| 13.16k | 905 | 6.9% |
Cash Flow Snapshot
Below shows the cash from operations, investing and financing for Textron Inc. More…
| Operations | Investing | Financing |
| 1.33k | -329 | -1.1k |
Balance Sheet Snapshot
Below shows the total assets, liabilities and book value per share for Textron Inc. More…
| Total Assets | Total Liabilities | Book Value Per Share |
| 16.48k | 9.45k | 35.51 |
Key Ratios Snapshot
Some of the financial key ratios for Textron Inc are shown below. More…
| 3Y Rev Growth | 3Y Operating Profit Growth | Operating Margin |
| 1.6% | 11.7% | 8.8% |
| FCF Margin | ROE | ROA |
| 7.2% | 10.3% | 4.4% |
Analysis
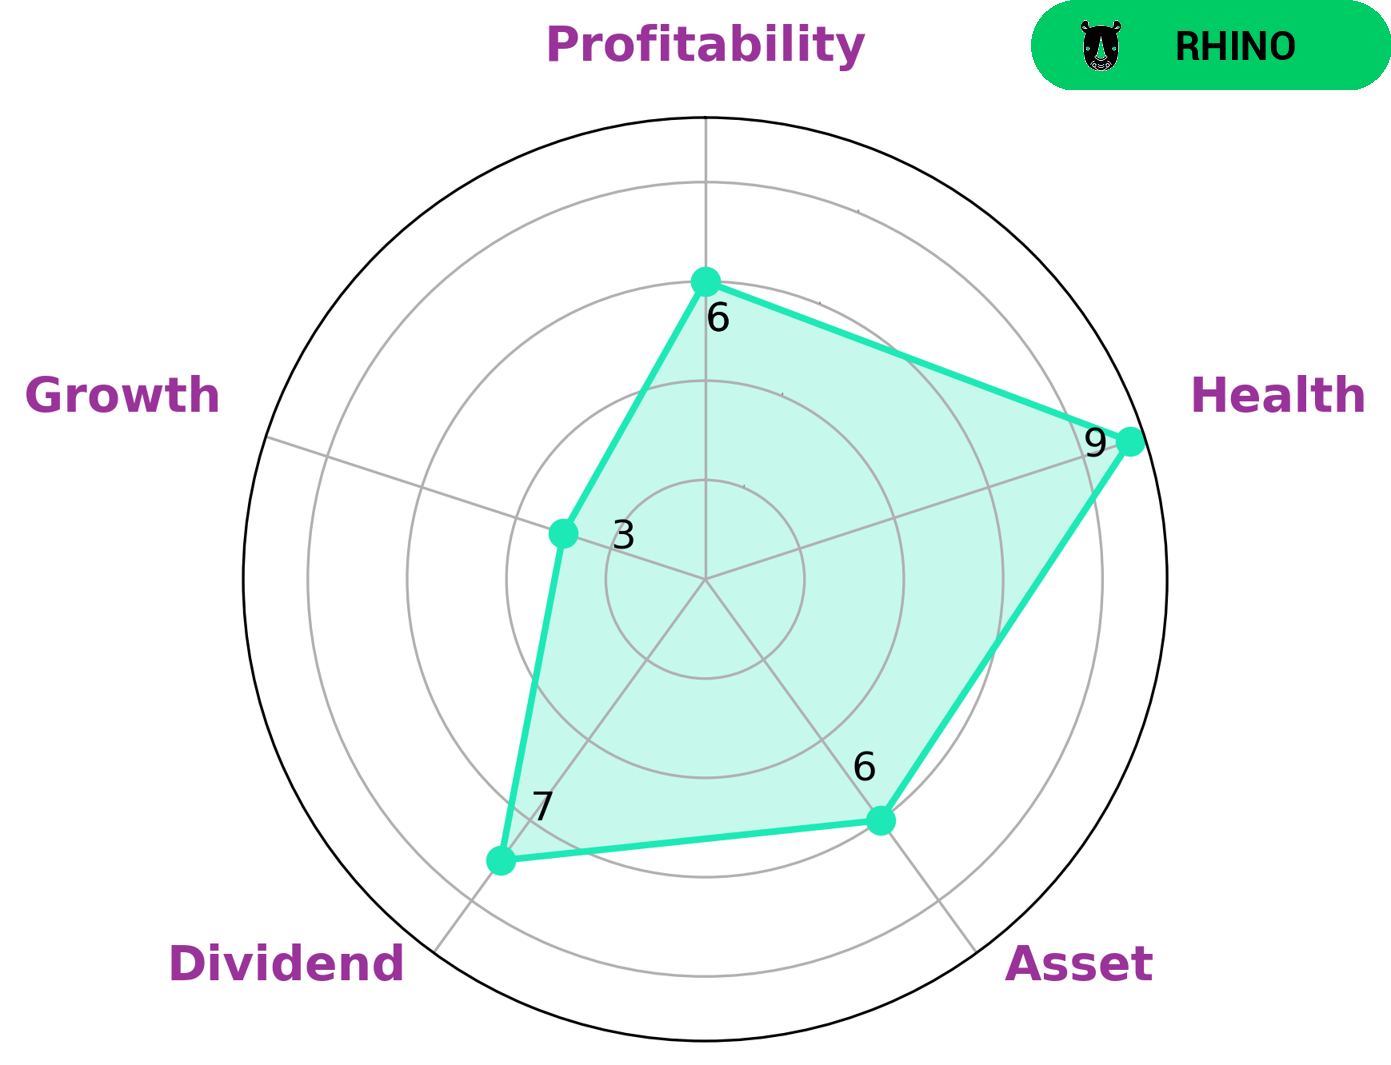
At GoodWhale, we conducted an analysis of TEXTRON INC‘s wellbeing. Our Star Chart analysis revealed that TEXTRON INC is strong in dividend, medium in asset, profitability and weak in growth. Additionally, TEXTRON INC has a high health score of 8/10 considering its cashflows and debt, indicating that it is capable to pay off debt and fund future operations. We classified TEXTRON INC as a ‘rhino’, a type of company that has achieved moderate revenue or earnings growth. Given its solid dividend yields, moderate asset strengths and average profitability, we believe TEXTRON INC could be attractive to value investors. Its relatively high health score is also likely to be appealing for those interested in making sure a company is able to meet its debt obligations and fund future operations effectively. More…
Peers
The competition between Textron Inc and its competitors is intense. Each company is vying for market share and customer loyalty. They are all fighting for the same thing: to be the best in the industry. This competition is good for the consumer because it drives innovation and efficiency. It also keeps prices down.
– Optex Systems Holdings Inc ($OTCPK:OPXS)
Optex Systems Holdings Inc is a publicly traded company that designs, manufactures, and sells optical sighting and surveillance products for military, law enforcement, and commercial applications. The company has a market capitalization of $18.39 million and a return on equity of 2.52%. Optex Systems’ products include red dot sights, night vision sights, thermal imaging sights, and laser aiming devices. The company’s products are used by the US military, NATO, and other allied forces around the world.
– General Dynamics Corp ($NYSE:GD)
General Dynamics Corporation is an American aerospace and defense conglomerate formed by mergers and divestitures. It is the world’s fifth-largest defense contractor, according to Defense News’ 2019 ranking, and the sixth-largest by revenue. The company ranked No. 98 in the 2018 Fortune 500 list of the largest United States corporations by total revenue. It is headquartered in Reston, Virginia.
General Dynamics’ main business units are Aerospace, Combat Systems, Information Technology, Mission Systems, and Marine Systems. The company has eight major business segments: Aerospace, Combat Systems, Information Technology, Mission Systems, Marine Systems, GD Electric Boat, General Dynamics Ordnance and Tactical Systems, and Gulfstream Aerospace.
– Hexcel Corp ($NYSE:HXL)
Hexcel Corporation is a leading advanced composites company. They develop, manufacture and market lightweight, high-performance structural materials, including carbon fibers, reinforcements, prepregs, honeycomb, matrix systems, adhesives and composite structures, used in commercial aerospace, space and defense, and industrial applications.
Hexcel’s market cap is 4.72B as of 2022. The company has a Return on Equity of 6.26%.
Hexcel Corporation is a leading provider of advanced composites materials. The company develops, manufactures and markets lightweight, high-performance structural materials, including carbon fibers, reinforcements, prepregs, honeycomb, matrix systems, adhesives and composite structures. Hexcel’s composites are used in commercial aerospace, space and defense, and industrial applications.
Summary
Investors in Textron Inc. have been rewarded for their faith in the company, as its reported 2nd quarter results for the fiscal year of 2023 have exceeded expectations. Total revenue for the quarter was USD 6448 million, a notable increase of 104.4% from the same period a year ago. Net income also rose 109.2% to USD 454 million, signaling a strong financial performance.
The stock price reacted positively on the news, pointing to investor confidence in Textron’s future prospects. As such, investors may find Textron Inc. an attractive option for long-term growth.
Related Posts


Recent Posts


