KIRKLAND’S Reports Unexpected Loss Despite Higher-Than-Expected Revenue
April 5, 2023

Trending News 🌧️
KIRKLAND’S ($NASDAQ:KIRK), a home decor and furniture retailer, reported an unexpected loss despite higher-than-expected revenue. The company reported a Non-GAAP EPS of -$0.09, which was short of the forecast by $0.05.
However, its revenue of $162.5M exceeded the estimate by $0.55M. The company also has an e-commerce website that offers a wide variety of products to customers all over the world. KIRKLAND’S stock has been volatile as of late, as investors remain uncertain about the company’s ability to generate consistent profits. Despite the unexpected loss reported today, the company’s higher-than-expected revenue gives analysts hope that it may be able to turn things around in the near future.
Market Price
On Tuesday, KIRKLAND’S reported unexpected losses despite its higher-than-expected revenue. The company’s stock opened at $3.1 and closed at $2.9, up by 1.1% from its previous closing price of 2.8. This unexpected loss came as a surprise to many investors, who had expected the company to be successful given its higher-than-expected revenue.
Despite the loss, investors remain optimistic as the company’s stock price continues to rise. It is clear that KIRKLAND’S is still a powerful player in the market and its future appears to remain bright. kirkland’s-reports-unexpected-loss-despite-higher-than-expected-revenue”>Live Quote…
About the Company
Income Snapshot
Below shows the total revenue, net income and net margin for Kirkland’s. More…
| Total Revenues | Net Income | Net Margin |
| 512.54 | -28.45 | -5.5% |
Cash Flow Snapshot
Below shows the cash from operations, investing and financing for Kirkland’s. More…
| Operations | Investing | Financing |
| -50.3 | -8.87 | 43.95 |
Balance Sheet Snapshot
Below shows the total assets, liabilities and book value per share for Kirkland’s. More…
| Total Assets | Total Liabilities | Book Value Per Share |
| 331.57 | 298.51 | 2.59 |
Key Ratios Snapshot
Some of the financial key ratios for Kirkland’s are shown below. More…
| 3Y Rev Growth | 3Y Operating Profit Growth | Operating Margin |
| -5.7% | 74.9% | -4.9% |
| FCF Margin | ROE | ROA |
| -11.6% | -43.0% | -4.7% |
Analysis
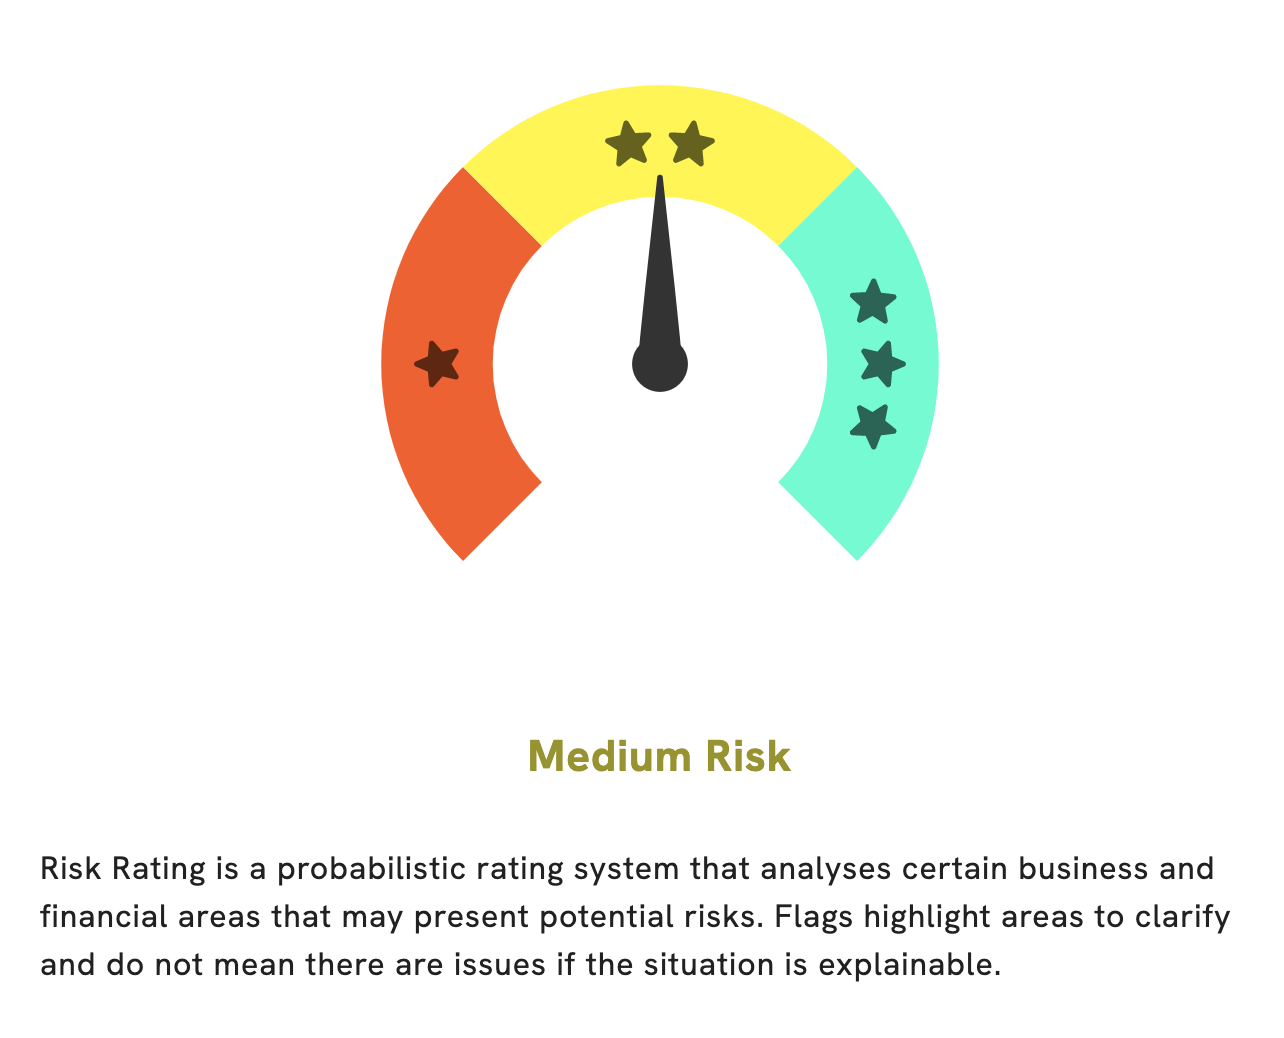
We recently conducted an analysis of KIRKLAND’S wellbeing, and based on our Risk Rating system, we determined that it is a medium risk investment in terms of financial and business aspects. Specifically, we detected one risk warning in the balance sheet, and we encourage potential investors to register with us to learn more about it. From our overall analysis, it appears that KIRKLAND’S is taking steps to reduce its risk profile, so we believe that it may be an attractive opportunity for those who are looking for moderate risk investments. kirkland’s-reports-unexpected-loss-despite-higher-than-expected-revenue”>More…
Peers
The company operates over 350 stores in 37 states and offers its products through its e-commerce website. Kirkland’s main competitors are Max Stock Ltd, bebe stores Inc, and Bed Bath & Beyond Inc. These companies are all leaders in the retail industry and offer similar products to Kirkland’s.
– Max Stock Ltd ($OTCPK:MAXFF)
Max Stock Ltd is a company that has a market cap of 226.6M as of 2022. The company has a ROE of 33.56%. The company does business in the stock market.
– bebe stores Inc ($OTCPK:BEBE)
L Brands, Inc. operates as a specialty retailer of women’s intimate and other apparel, beauty and personal care products, home fragrance products, and accessories under the Victoria’s Secret, Bath & Body Works, Pink, La Senza, Henri Bendel, and Mast General Store brands. The company operates in three segments: Victoria’s Secret Stores, Bath & Body Works, and Victoria’s Secret Direct. It has a market cap of $67.46M and a Return on Equity of -2.11%.
– Bed Bath & Beyond Inc ($NASDAQ:BBBY)
Bed Bath & Beyond Inc. is an American multinational chain of domestic merchandise retail stores. Bed Bath & Beyond operates through 1,507 stores in the United States, Puerto Rico, Canada, and Mexico. The company’s market capitalization is $422.28 million and its return on equity is 146.77%. Bed Bath & Beyond was founded in 1971 and is headquartered in Union, New Jersey. The company sells a variety of home goods, including bedding, bath products, kitchen items, home decor, and small appliances.
Summary
The company posted a Non-GAAP Earnings Per Share (EPS) of -$0.09, which missed the analyst consensus estimate by $0.05. This shows that the company is still struggling to remain profitable despite improving revenue year-on-year, but investors may take some comfort from the beat on revenue. It remains to be seen whether Kirkland’s can continue to grow their revenue and improve their performance going forward.
Related Posts


Recent Posts


Investing Everyone Can Do.
Investing shouldn’t be exclusive to a select few. We believe everyone should have the opportunity to grow their wealth. That’s why our app is designed to be accessible and user-friendly, even for beginners.
